Check your page reports (New features and metrics added)
Summarize this article via
We are continuously updating our tool to provide you with an improved social media management experience. So this time we worked on the social media page reports. We have updated all social platforms’ page reports. Added new features, metrics, and many other insightful data to allow you to have a better understanding of your social media presence.
In this article, we will briefly mention and go over what we have updated in our social media page reports. Without further ado, keep reading to discover new additions, changes, and improvements.
Instagram page reports
New postcards
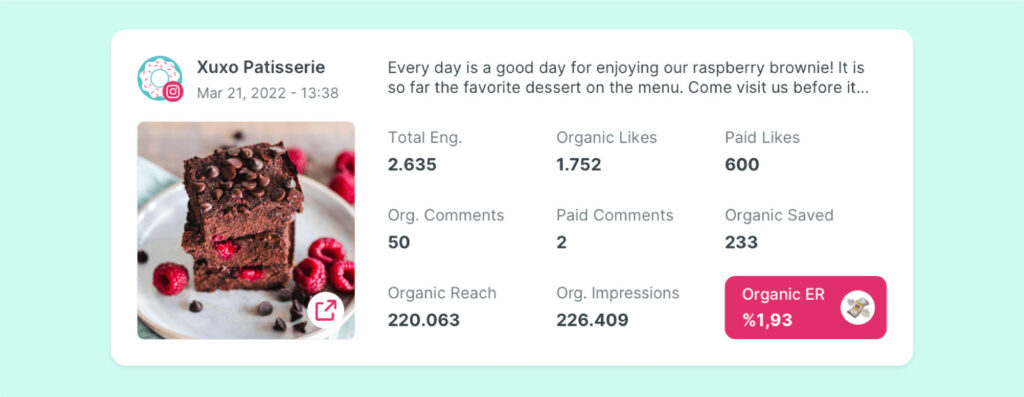
We know metrics are the heart of Instagram management, and tracking them is essential. So, we wanted to make that process better by updating page report postcards. You can see so many new metrics in a well-organized way in your Instagram page reports.
The “hashtag analysis” table
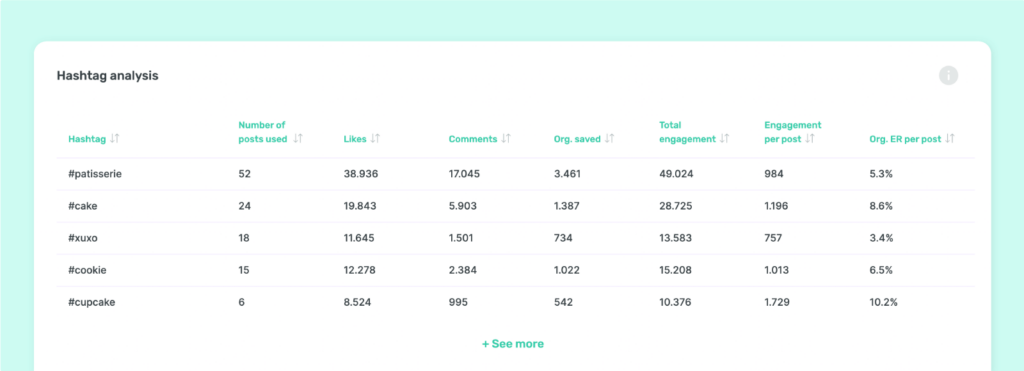
We use hashtags every day to reach more people with similar interests, but what about measuring their efficiency? Well, it is so easy now! Discover the hashtags that work best to increase your Instagram content’s reach and engagement. Stay in the loop with hashtag analysis, and enhance your Instagram experience by getting more done with less.
Facebook page reports
New metrics added to Facebook reports
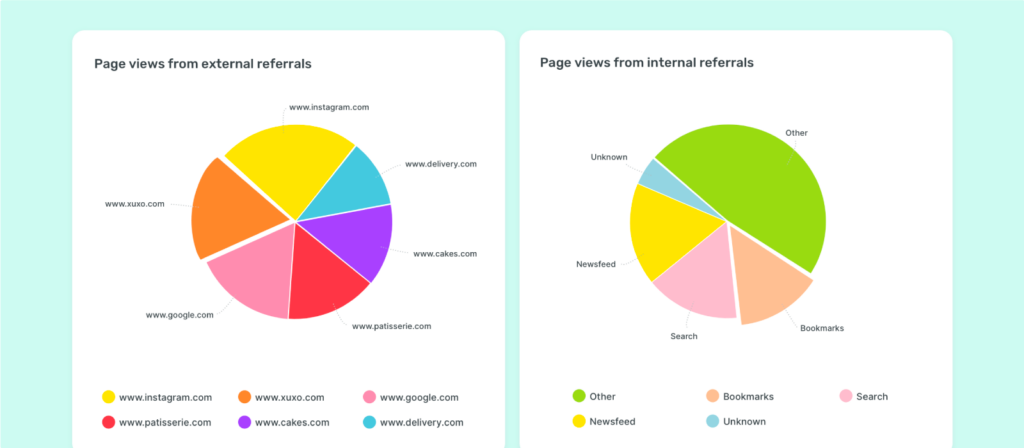
Having a high volume of page views is beneficial and needed for sure. Imagine exactly knowing the source of that views for your page! It would be so helpful to decide your next strategy on Facebook. Well, you are welcome 🤗 From now on, you will be able to obtain where your page views come from more clearly. With the new metrics and chart representation, you can easily understand and manage the external and internal referrals for your Facebook page.
Comparable and holistic graphs were added
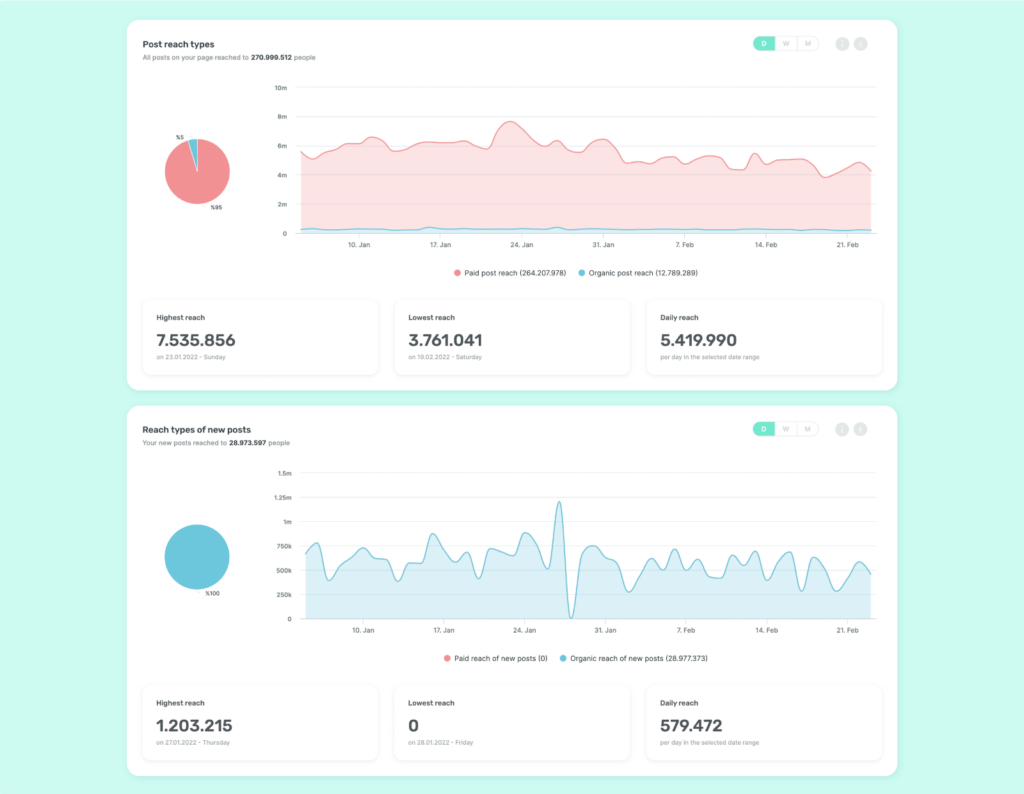
Got confused while measuring your reach, impression, or engagement? Where do these metrics are coming from? Or, had question marks on the differences between your new and old post’s metrics? No worries, we got you! We have updated our Facebook reports and added a lot of new graphs to show where this reach, impression, or engagement comes from. Moreover, you can also observe the differences between your old and new posts with new graphs 🥳
Twitter page reports
Twitter postcards — with more complete metrics
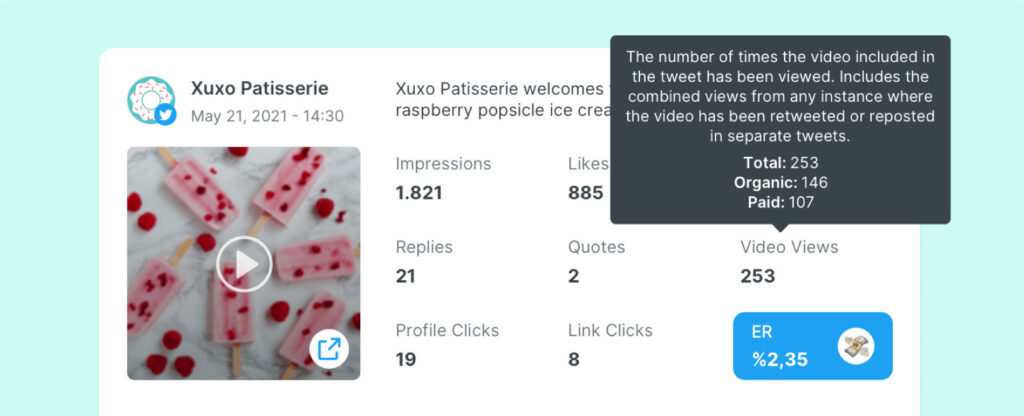
We know metrics are the heart of Twitter management, and tracking them is essential. So, we wanted to make that process better by updating the Twitter page report postcards. From now on, you will be able to new metrics such as impressions, video views, or clicks. Moreover, we are providing their organic or paid distribution, too.
Brand new metrics were added
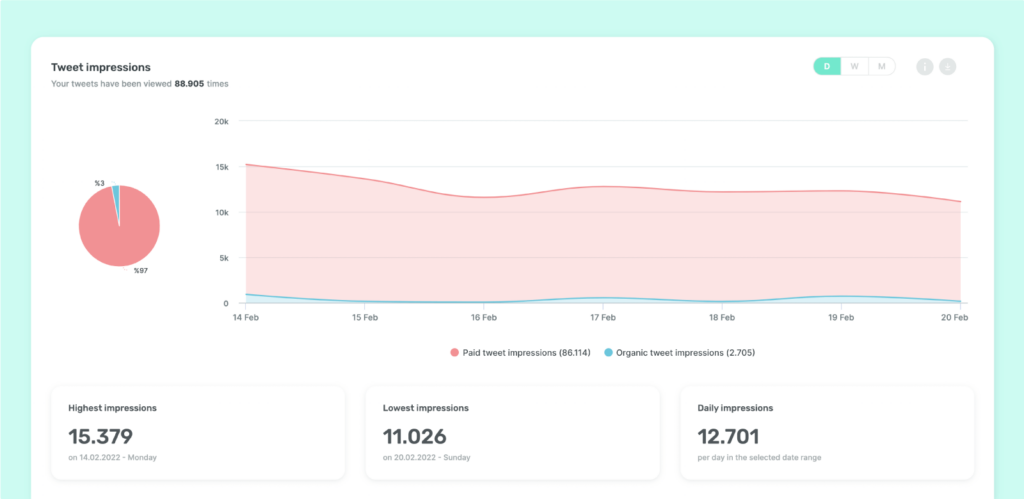
It is believed that Twitter is the best engagement platform with the audience. Well, when that is the point, we believed it would be so handy for you to see completely new metrics in your Twitter reports. So, enjoy the “impressions” and “organic-paid” distribution metrics for most of the Twitter metrics 🤗
YouTube page reports
New metrics added to YouTube reports
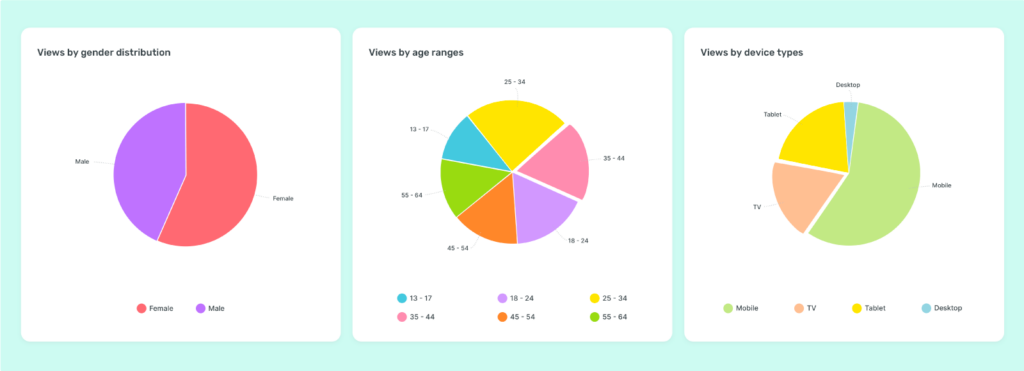
The data says that “70% of millennial users watch YouTube videos to learn how to do something new or learn about something they’re interested in.” When the potential is so high we thought it would be so helpful for you to get to know your audience. We have added new metrics to our YouTube page reports. Enjoy the details of views as distributed among genders, ages, device types, and more.
Comparable and holistic graphs
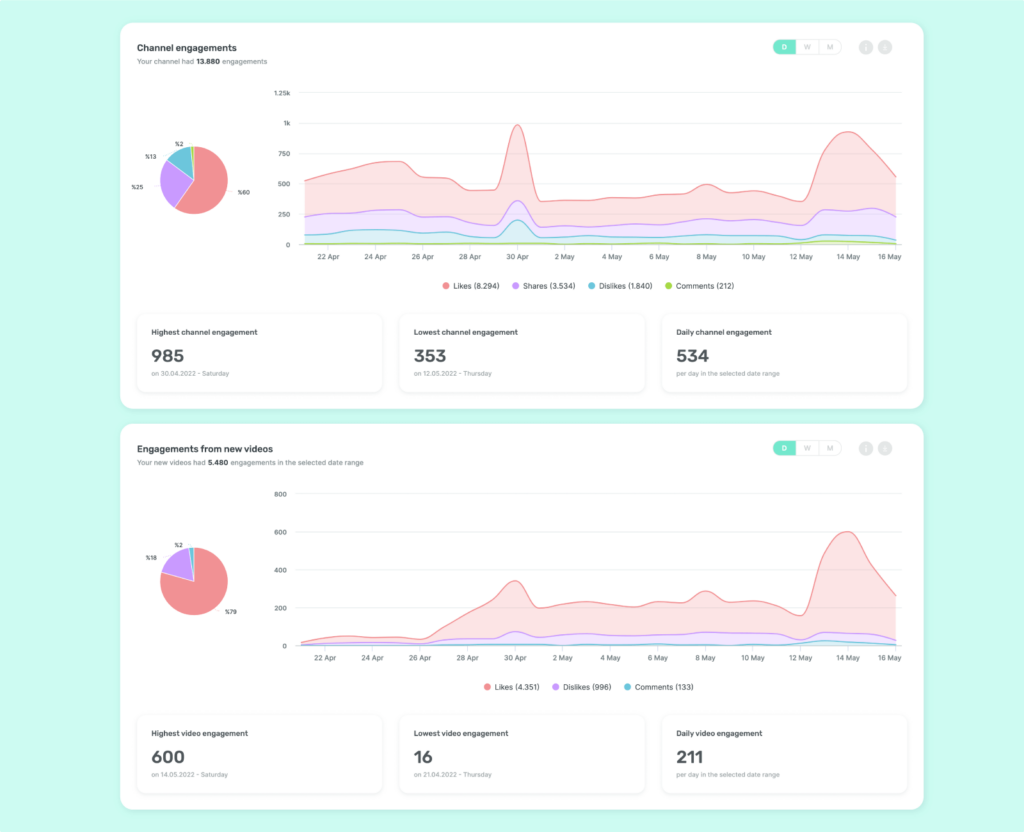
Got confused while measuring your reach, impression, or engagement? Where do these metrics are coming from? Or, had question marks on the differences between your new and old post’s metrics? No worries, we got you! We have updated our YouTube reports and added a lot of new graphs to show where this reach, impression, or engagement comes from. Moreover, you can also observe the differences between your old and new posts with new graphs 🥳
LinkedIn page reports
New metrics added to LinkedIn reports
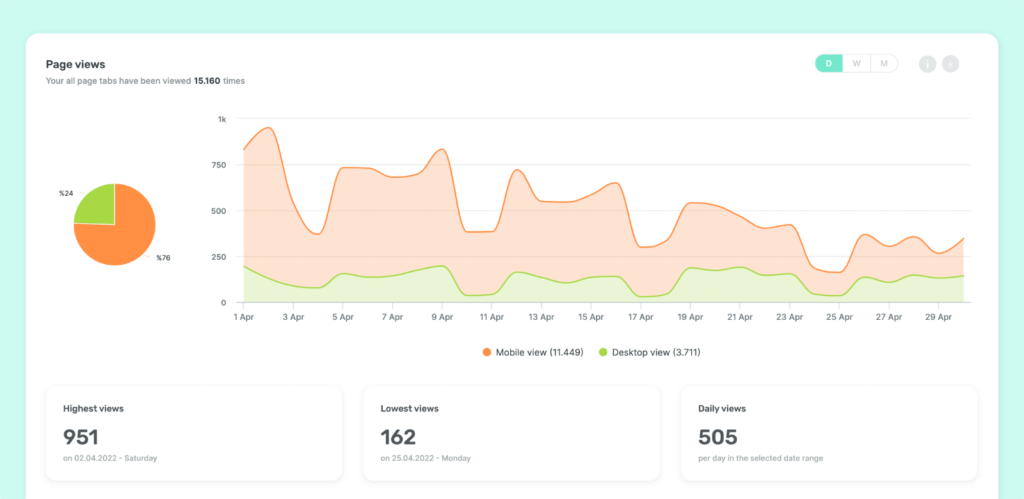
It is our pleasure to share that we have added new metrics and graphs such as page views, and page and post engagements. We believe it would be so handy for you to see completely new metrics in your LinkedIn reports. So, enjoy the brand new and fresh metrics on your LinkedIn page reports 🤗
New postcards
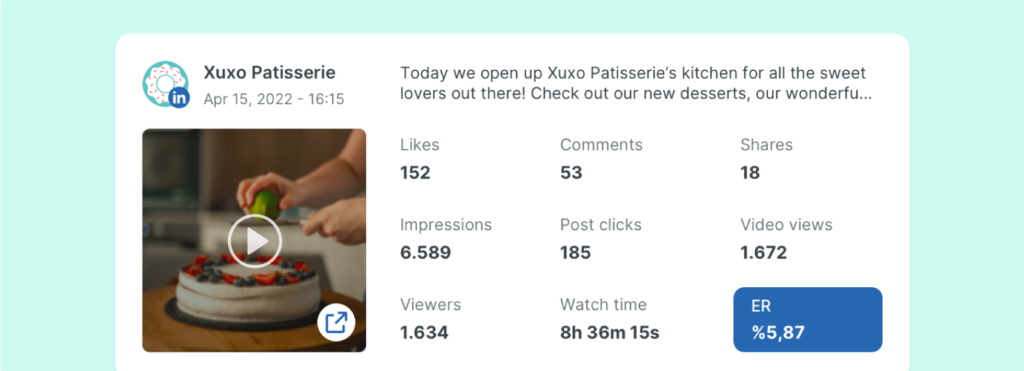
LinkedIn is a sacred social network, especially for the B2B sector. The platform is a magnet for professionals and decision-makers. There are many ways to grow your followers on the LinkedIn company page. For sure, one and the most essential one is to understand how your data speaks to you. So, we wanted to make that process better by updating the LinkedIn page report postcards. From now on, you will be able to new metrics such as watch time, viewers, and ER. Hope it helps!
General update for all the page reports
XLS – CSV exports are now available
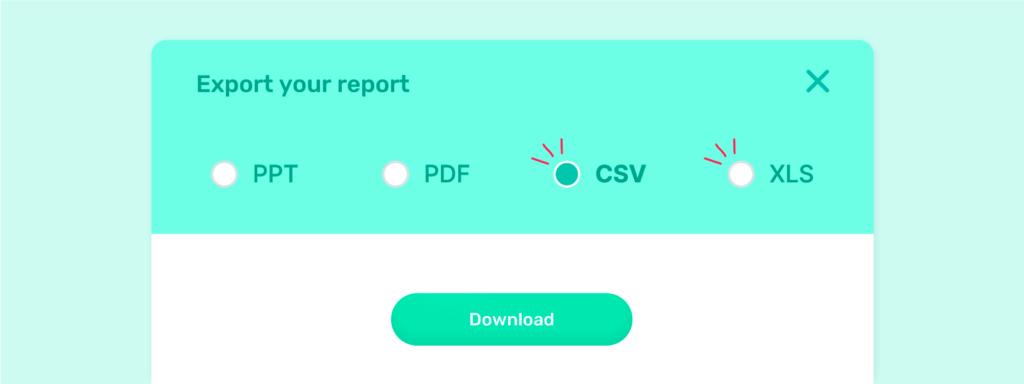
Social media page reports include so much insightful data for your brand and social media strategy. With the help of the page reports you can easily manage your online presence and set realistic goals for your social media management without all the tedious data collection. What is better than having such a report is to export those reports for many different formats – like PPT, PDF, CSV, and XLS. Choose the format you feel comfortable with, and we will handle the rest!
Attention please 📣

The old reports will be depreciated by 01 September 2022. If you want to keep your data, please be sure you save your reports before the mentioned date. Otherwise, you won’t be able to reach the old version of them 🥲
