

YouTube analytics guide 2025: How to read, track, and grow your channel
Summarize this article via
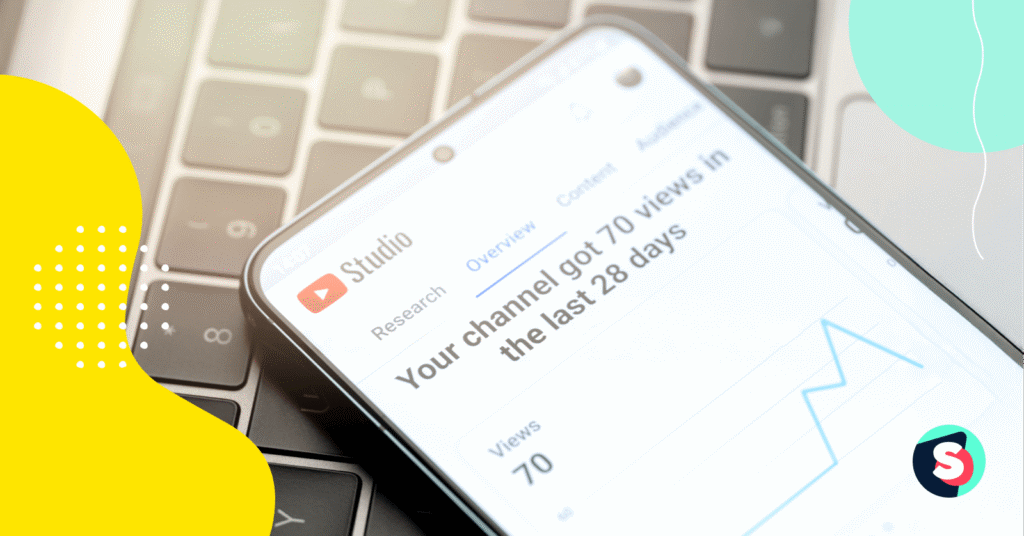
When you open YouTube Studio and stare at a dashboard full of numbers, it can feel a little like reading tea leaves with autoplay turned on. 🍵📊
Views rise, then vanish. Watch time looks solid, but subscribers stall. CTR says “great,” yet conversions don’t budge.
You’re not alone. More than 2.5 billion people use YouTube every month, and together they watch over 1 billion hours of content every single day. With 70 billion daily shorts views (Think with Google) and more than 500 hours of content uploaded every minute, attention on YouTube moves fast—and marketers can’t afford to guess what’s working.
But when you learn to read YouTube analytics correctly, you stop guessing and start predicting.
The metrics inside YouTube Studio reveal the patterns behind every view—why someone clicked, how long they stayed, and when they drifted away.
And the difference between good and great often hides in the numbers:
A “healthy” click-through rate typically falls between 4 and 6 percent, but the best videos push beyond 10 percent. Meanwhile, average ad campaigns see CTRs around 0.84 percent with CPMs near $3.53, meaning organic performance is still your biggest growth lever if you know how to optimize it.
So, this 2025 YouTube analytics guide will show you exactly how to turn data into direction—from CTRs and watch time to revenue and retention. You’ll understand what each number means, how to act on it, and how to build a reporting rhythm that turns weekly stats into long-term strategy.
Key takeaways (TL;DR)
- YouTube analytics is your performance GPS—it tells you what’s working, what’s not, and what to test next.
- Start with the Overview, then dig into Reach, Engagement, Audience, and Revenue tabs—each one uncovers a different growth signal.
- CTR + watch time + retention = your performance triangle. Together, they reveal how strong your hook is and where attention fades.
- Check “When your viewers are on YouTube” to find your best posting time—it’s built directly from your audience data.
- Shorts vs. long-form analytics: Shorts spike fast; long-form builds depth. Track them separately for clarity.
- Views vs. watch time: Views measure reach; watch time measures relevance. Prioritize the latter for real growth.
- Revenue metrics (CPM, RPM, playbacks) help pinpoint which videos actually generate profit, not just engagement.
- Sociality.io offers a unified YouTube analytics dashboard to connect pages and track KPIs, audience, devices, traffic sources, campaigns, and post performance—all in one place.
- Review your analytics weekly, summarize monthly, and recalibrate quarterly—that’s how you turn numbers into decisions.
- How to access YouTube analytics
- YouTube analytics: Core tabs and structure
- Key YouTube metrics and what they really mean (Channel and video level)
- How to interpret metrics (And avoid common mistakes)
- How to use YouTube analytics to improve and optimize performance
- Advanced analytics and pro tips
- Future trends and what’s next
- YouTube analytics glossary 💫
- Wrapping up: Turning data into growth
How to access YouTube analytics
Before diving into metrics, let’s start with the basics: where do you actually find all this data?
YouTube doesn’t make you chase it across tabs — everything lives inside YouTube Studio, the command center for your content. Whether you’re on desktop, mobile, or working with data exports, YouTube Analytics is designed to show you what’s happening in real time and over time.
But the view changes depending on how deep you go. Let’s walk through it step by step.
On desktop: The full analytics dashboard
- Go to YouTube Studio → studio.youtube.com
- In the left menu, click Analytics.
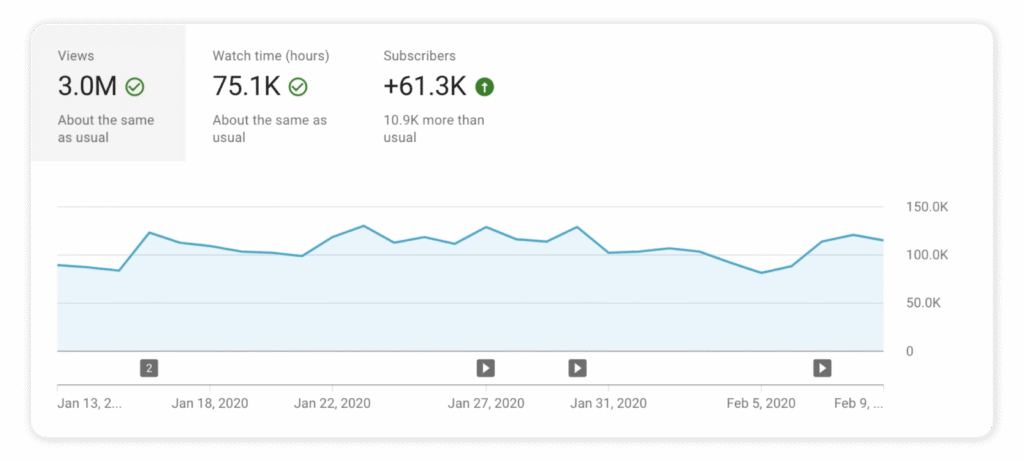
- You’ll land on the Overview tab by default — showing total views, watch time, subscribers, and estimated revenue.
- Switch tabs for Reach, Engagement, Audience, and Revenue to dig deeper.
- Click Advanced Mode in the top-right corner for detailed metrics, comparisons, and exports.
The Advanced Mode view lets you filter by:
- Date range (last 7, 28, 90, or custom)
- Content type (long-form, Shorts, Live)
- Geography, device, traffic source, or subscription status
It’s where most marketers spend their time when they need to explain the “why” behind a trend.
On mobile: YouTube Studio app
The YouTube Studio app (available on iOS and Android) is the analytics pocket version. You’ll see simplified dashboards — great for quick check-ins, not full reports.
You can:
- Track real-time views for your latest videos
- Review CTR, average view duration, and top-performing videos
- Monitor subscriber growth and audience activity
- Check comment engagement without switching social media analytics tools
If you manage multiple brands or channels, this mobile app can keep you updated between meetings or campaign runs. But for data exports or detailed audience segmentation, desktop still wins.
Advanced access: YouTube Analytics API
For teams that live in data, YouTube offers an Analytics and Reporting API (officially documented by Google for Developers).
It’s what powers integrations inside tools like Sociality.io, helping marketers pull analytics data directly into unified dashboards.
With the API, you can:
- Build custom dashboards or connect to BI tools
- Combine YouTube data with performance metrics from other social platforms
- Automatically export metrics (views, watch time, traffic sources, etc.)
If you manage multi-channel campaigns or create weekly executive reports, API-level access saves time and ensures you’re looking at the same data source every week.
Data thresholds and timing
YouTube Analytics isn’t instant magic. It only starts showing data after your videos get a minimum number of views. Sometimes it can take up to 48 hours for new data to appear or adjust for accuracy.
And if you’ve ever wondered why your numbers don’t match hour by hour, that’s normal. YouTube updates its analytics periodically to filter invalid traffic, spam, or replays that don’t meet view-quality standards.
To make sure you’re comparing apples to apples, always:
- Use the same date range when comparing videos
- Wait at least two full days before analyzing new uploads
- Track metrics at both video and channel levels
Connecting YouTube analytics to external tools
Native analytics show you what’s happening inside YouTube. But marketing rarely lives on a single platform.
By connecting YouTube Analytics with Sociality.io, marketers can:
- Connect pages and monitor YouTube performance in a single dashboard
- View summary KPIs, traffic sources, campaign analytics, and post-level metrics with filters/tags
So, whether you’re checking metrics in a taxi or building a quarterly presentation, you’ll always have full context — without jumping between tabs.
YouTube analytics: Core tabs and structure
When you open YouTube Studio, the first thing you’ll see under Analytics is a series of tabs—Overview, Reach, Engagement, Audience, and Revenue. Each one tells a different part of your channel’s story. Think of them as chapters in your marketing report: awareness, interaction, loyalty, and monetization.
Overview
Overview is your quick health check. You’ll see your total views, watch time, subscribers gained or lost, and estimated revenue. This is the first place to look when you need a pulse on performance. The graph shows trends over your selected date range, so if something spikes or dips, you’ll notice it right away. From here, you can click any data point to jump deeper.
Reach
Reach tells you how viewers discover your content. It includes impressions, click-through rate (CTR), unique viewers, and traffic sources. This is where the funnel begins: impressions show how many people saw your thumbnails, and CTR shows how many clicked. The average CTR across YouTube sits between 2% and 10%, with 4–6% being a strong benchmark. If your impressions rise but CTR falls, your thumbnails or titles might need fine-tuning.
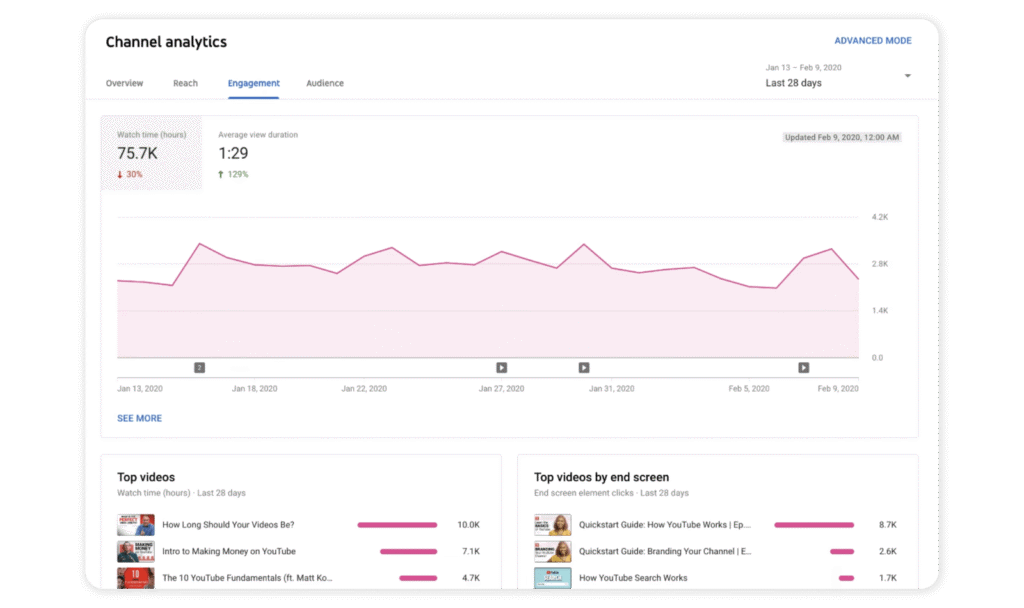
Engagement
Engagement goes beyond clicks—it measures attention. You’ll find metrics like watch time, average view duration, average percentage viewed, and top-performing videos. This is where retention curves live, showing exactly when viewers drop off. A smooth curve means pacing is strong; a sharp dip in the first 10 seconds means your hook isn’t landing. Marketers often focus too much on reach, but engagement is what signals actual content quality.
Audience
Audience reveals who’s watching. You’ll see returning vs. new viewers, watch time from subscribers, age, gender, and geography. It also shows when your viewers are most active. This single graph can redefine your posting strategy. If you notice your audience peaks between 6–9 p.m. local time, shift your publishing schedule to match. For global brands, this data helps localize campaigns and captions. You’ll also find metrics for languages, subtitles, and devices—handy for testing mobile vs. desktop behavior.
Revenue
Revenue is where organic strategy meets business results. It tracks estimated revenue, CPM (cost per thousand impressions), and RPM (revenue per thousand views). You can see which videos bring in the most income, which ad formats are performing best, and how your monetized playbacks evolve over time. In 2025, the average YouTube ad CPM is around $3.53, with CPV (cost per view) averaging $0.026. If your organic content drives better engagement than your paid benchmarks, that’s a sign to double down on your creative direction.
Research
Research (previously known as Content Gap Insights) is the newest addition to YouTube Analytics. It helps you discover what your audience searches for but can’t easily find. You can look up topics, related queries, and trends over time—perfect for planning future content calendars. Think of it as SEO meets creative brainstorming, directly inside YouTube.
Together, these tabs create a full picture: Reach brings them in. Engagement keeps them watching. Audience tells you who they are. Revenue shows what it’s worth. Once you start reading these layers together instead of in isolation, your reports start to tell real stories—not just numbers on a screen.
Key YouTube metrics and what they really mean (Channel and video level)
Let’s be honest—YouTube Analytics can look overwhelming at first glance. There are dozens of numbers, percentages, and graphs blinking at you. But when you know which metrics to focus on, the noise turns into a narrative.
I like to group YouTube metrics into five main categories: Reach, Engagement, Retention, Audience, and Monetization. Together, they tell you how people find your content, why they stay, and what impact that attention has on your business goals.
A. Reach and discovery metrics
These numbers show how people find your videos.
Impressions – How many times your video thumbnail was shown across YouTube surfaces like Home, Search, and Suggested Videos. Think of impressions as the “visibility currency” of YouTube.
Impressions click-through rate (CTR) – The percentage of people who clicked your video after seeing the thumbnail. Average CTRs across YouTube fall between 2% and 10%, but if you’re hitting 4–6%, you’re in the healthy zone. Thumbnails and titles drive this number, not the video itself.
Views – The number of legitimate views your video received. YouTube only counts real, qualified plays—meaning no quick bounces or spam traffic.
Unique viewers – The estimated number of individuals who watched your content during a specific period. This helps you gauge reach beyond just total views.
Traffic sources – Where your views come from: search, suggested videos, external links, playlists, browse features, or channel pages. A healthy channel usually has a balanced mix of Suggested and Search traffic. If one dominates, you might be leaning too heavily on a single discovery path.
Impressions-to-watch time conversion – The secret conversion most marketers forget. It’s not enough that people click—you need them to stay. Pair CTR with average view duration to see how well clicks turn into watch time.
B. Engagement and retention metrics
Engagement is what separates curiosity from loyalty.
Watch time (hours or minutes) – The total amount of time people spent watching your videos. It’s one of YouTube’s strongest signals for ranking and recommendation.
Average view duration – The average amount of time each viewer spends watching. This number shows how well your content holds attention. For example, if your average view duration is 3:20 and your video is 10 minutes long, only a third of it is being watched—time to test a tighter edit.
Average percentage viewed – A more relative measure of retention, showing what portion of the video people watched on average. High retention means strong pacing; low retention means drop-offs or slow openings.
Audience retention curves – These graphs tell the story visually. A flat curve is gold—it means you’re keeping viewers. Sudden drops in the first 15 seconds often signal weak hooks or intros that take too long to get to the point.
End-screen element click rate – Measures how effectively your end screens drive action. If your CTR is under 1%, you might need clearer CTAs or more relevant video suggestions.
Card click-through rate – Similar idea, but for mid-video prompts. Cards perform best when they naturally follow what the viewer just saw—like offering a deeper dive instead of a detour.
Engagement actions – Likes, comments, shares, saves. They’re the emotional signals in your analytics. High shares or saves often outperform likes in predicting discovery potential because they tell YouTube the video is worth spreading.
Subscriber growth – Your net change in subscribers for a given period. If certain videos drive more subscriptions than others, analyze their structure and tone—they’ve likely hit the sweet spot between value and personality.
C. Audience and demographic insights
This section helps you move from broadcasting to connecting.
Returning vs. new viewers – Returning viewers are your brand advocates; new viewers are your growth engine. The balance shows whether your channel is nurturing loyalty while still attracting fresh eyes.
Viewer demographics – Age, gender, and region. These numbers are crucial when aligning creative tone or ad targeting.
Geography – Your top countries and regions. For marketers, this can influence language choices, subtitles, or even campaign timing.
Device types – YouTube reports viewership across mobile, desktop, tablets, TVs, and game consoles. Since roughly 63% of total watch time comes from mobile, vertical-friendly framing and concise visuals are non-negotiable.
When your viewers are on YouTube – This chart is pure scheduling gold. It shows the days and hours when your audience is most active. Post within these windows, and you’ll often see an immediate lift in early engagement.
Top languages and caption use – For global channels, tracking subtitle usage reveals how international your reach really is. Adding captions can also boost accessibility and SEO.
D. Monetization and revenue metrics
When you cross the threshold for YouTube’s Partner Program, this is where business meets creativity.
Estimated revenue – Your projected earnings from ads, memberships, and other sources.
CPM (cost per thousand impressions) – How much advertisers pay per 1,000 ad views. The 2025 average hovers around $3.53, though this varies by niche and region.
RPM (revenue per thousand views) – What you actually earn per 1,000 views after YouTube’s share. RPM is a clearer reflection of profitability than CPM.
Monetized playbacks – The number of video views that showed at least one ad. If this rate drops, it might mean ad inventory or eligibility changes.
Ad types – Skippable, non-skippable, bumper, overlay, or display ads. Each one affects viewer experience and watch time differently.
YouTube Premium revenue – Earnings from subscribers who watch your videos through Premium rather than ads.
Memberships and Super Chat – If enabled, these add layers of community-driven monetization beyond ads.
E. Other useful metrics
Views from subscribers vs. non-subscribers – High subscriber-driven views mean loyalty; high non-subscriber views signal strong discoverability. The goal is a balance between the two.
Watch time from subscribers – Often correlates with engagement quality. Loyal viewers watch longer, comment more, and share more.
Top playlists – Playlists extend session time. If certain playlists outperform, feature them prominently on your channel homepage.
External referrers – Websites or social media platforms driving traffic to your videos. Embeds from blogs or LinkedIn posts can quietly drive long-tail traffic.
Annotations and cards drop-off rate – Measure if interactive elements distract or convert. Too many pop-ups can lead to exits instead of clicks.
Once you understand these metrics, your analytics dashboard becomes a strategy board. You stop reacting to views and start recognizing patterns—why one format outperforms another, why certain hooks retain attention, and when your storytelling rhythm actually pays off.
Next, we’ll translate these numbers into strategy. In the next section, you’ll learn how to interpret YouTube metrics and what to watch out for—because data without context can easily lead you in the wrong direction.
How to interpret metrics (And avoid common mistakes)
Once you understand what the numbers mean, the next step is learning to read them right. Metrics tell stories—but only if you interpret them in context. Too often, marketers chase spikes that don’t matter or panic over normal fluctuations. Let’s fix that.
High CTR, low retention
An 8% CTR looks impressive until you realize viewers only watched 30% of the video. That means your thumbnail worked, but your content didn’t deliver. The algorithm sees that mismatch and pulls back your reach.
To fix it, make sure your thumbnail reflects real value and that your first 10 seconds deliver it fast. High CTR + strong retention = sustainable growth.
Steady impressions, weak views
If impressions stay high but views flatline, your content’s being seen by the wrong audience. Check traffic sources and top geographies. If you’re surfacing in Browse but not Search, or in regions that don’t fit your language, your metadata or topic alignment might need refining.
High watch time + Low engagement = Content fatigue
If your watch time stays steady but likes, comments, or shares dip, viewers may be watching passively. That’s a sign your format’s grown predictable. Add variation—new editing styles, guest appearances, or shorter cuts—to refresh interest.
CTR declines may signal a thumbnail burnout
Even strong channels face visual fatigue. Thumbnails lose impact when they start blending in. Review quarterly and refresh old visuals for your top evergreen videos. The sweet spot is 4–6% CTR with steady retention; anything higher with low watch time signals clickbait, not performance.
Audience dips — not always a problem
Seasonality and algorithm testing create natural waves in traffic. A dip doesn’t mean decline; it means it’s time to zoom out. Compare month-over-month, not week-to-week. Patterns matter more than peaks.
Mixing Shorts with long-form data
Shorts are great for visibility, long-form for loyalty. Their analytics don’t mix well. Always analyze them separately—Shorts metrics skew averages, and retention percentages mean different things when your video is 30 seconds versus 10 minutes.
Ignoring retention curves
Retention curves are your creative truth-teller. They’ll show you exactly where you lose interest. Most drop-offs happen before the 15-second mark—tighten your intros, raise pacing, and use visuals early.
If you see a retention spike, it means people rewatched that part. Study it—it’s what they found valuable or entertaining.
Overreacting to one video
A viral video or an underperformer doesn’t define your channel. The algorithm tests content constantly, and even high performers taper off. Look for patterns across videos before making strategic changes. Weekly data is noise; monthly data is signal.
Forgetting to back up data
YouTube Analytics keeps a limited history. Always export or integrate with a social media analytics tool like Sociality.io to preserve long-term insights, especially for quarterly comparisons. Historical data is what turns intuition into prediction.
If you’re not using Sociality.io and you’re currently a Hootsuite user—but you’re tired of rapid price increases and paywalled features—check out our deep dive on Hootsuite alternatives. I personally reviewed each tool one by one, evaluated performance against feature-based criteria, and summarized user feedback and ratings.
When you interpret metrics with curiosity instead of panic, analytics stop being overwhelming—they start becoming creative fuel. Every line in your dashboard is a lesson in what your audience values most.
How to use YouTube analytics to improve and optimize performance
Now that you know what every metric means, it’s time to make them work for you. Analytics aren’t a report card—they’re a playbook. The goal isn’t to stare at graphs; it’s to translate patterns into action. When you do that consistently, your YouTube channel becomes less about luck and more about learned rhythm.
Find your top-performing videos and reverse-engineer success
Start by identifying which videos perform best across multiple metrics—CTR, watch time, and engagement. Don’t just look at views; check if people actually stayed and interacted.
When you find your top performers, ask:
- Was the intro quicker or more direct?
- Did you use a specific keyword or visual pattern in the title?
- Was the pacing tighter?
- Did comments mention clarity, humor, or visuals?
Make a habit of listing your top five videos every month and writing down what they have in common. That’s your creative blueprint.
If you notice a spike in suggested video traffic, analyze which video(s) you were paired with. You might find a genre, sound, or format that the algorithm associates with your audience’s interests. Creating follow-ups or sequels in that same tone can amplify reach.
Analyze drop-offs to strengthen retention
YouTube gives you one of the most powerful visual tools in social media analytics: the audience retention curve. Watch where people exit, not just how long they stay.
If viewers drop right after the intro, tighten it. If the curve dips at a long pause or transition, cut it shorter next time. And if there’s a spike halfway through—meaning people rewatched—that moment’s gold. Replicate that energy in future scripts.
YouTube recommends aiming for at least 60–70% average completion for videos under five minutes. For longer formats, staying above 50% is strong. The closer you get to a flat retention curve, the more likely the algorithm will push your content further.
Optimize thumbnails and titles for clicks and honesty
The best thumbnails tell a story in one frame. They don’t need to scream; they just need to speak clearly. Keep text minimal (three to five words max), use contrast, and avoid repeating the title.
When your CTR climbs but retention drops, it’s often a sign of clickbait tension—the title promised something the video didn’t deliver. Reframe your value proposition instead of overselling it. A thumbnail that earns 5% CTR with strong watch time will outperform a 9% CTR with weak retention in the long run.
Refresh older thumbnails quarterly. A visual update can revive evergreen videos that still rank in search but have slowed down in discovery.
Use traffic sources to build a stronger discovery loop
Go to the Reach tab and check your top traffic sources:
- YouTube Search shows how people find you organically. Study your keywords here for SEO clues.
- Suggested Videos indicate algorithmic affinity—your content fits into a watch cluster.
- External includes embeds, blog links, and social shares—great for measuring campaign impact.
If “Suggested” is growing faster than “Search,” that’s a sign your storytelling and retention are strong. If “External” dominates, you might be relying too much on off-platform promotion—try optimizing your metadata and hooks to bring viewers in directly from YouTube instead.
Post when your audience is actually watching
In the Audience tab, you’ll see a purple heatmap called When your viewers are on YouTube. This is your scheduling compass.
If your viewers are most active around 7 p.m. local time, post an hour earlier to give the algorithm room to distribute before peak hours. Test it for two weeks, then compare average views and engagement. Many marketers see 15–25% higher early engagement simply by aligning posting time with audience activity.
And remember—YouTube’s traffic is global. If you have viewers in multiple regions, stagger uploads or experiment with time-zone targeting through paid campaigns.
Build playlists and internal links that guide viewers
Don’t let your audience leave after one video. Use end screens, cards, and playlists to build internal traffic loops. Group videos by intent (“How to,” “Behind the scenes,” “Campaign breakdowns”) so viewers always have a next step.
Playlists also boost session time, which YouTube considers a strong engagement signal. The more time people spend watching your content chain, the higher your overall visibility.
Experiment with formats and track reactions
If your analytics show consistent performance but no growth, the format might be stale. Test new angles: shorter cuts, visual explainers, collaborations, or Shorts. Each experiment gives you new data to learn from.
YouTube Shorts, for example, often drive massive reach but limited subscriptions. Long-form videos convert better because they build context and trust. Pair the two strategically: use Shorts to attract, long-form to retain.
Turn insights into weekly routines
Analytics only help when you make them a habit. Here’s a cadence many marketing teams use:
- Weekly: Check CTR, retention, and audience activity.
- Monthly: Compare top videos, traffic sources, and subscriber growth.
- Quarterly: Audit playlists, re-optimize thumbnails, and evaluate format performance.
This rhythm keeps you close to the data without getting lost in it.
Use Sociality.io to centralize your YouTube tracking
YouTube’s native analytics is great for single channels—but marketers often want a clearer workspace. Sociality.io lets you connect pages and view a YouTube analytics dashboard with summary KPIs, audience and device/OS breakdowns, traffic sources, campaign analytics, and post-level metrics with tags and filters—reducing time spent toggling tabs.
So yes, analytics tell stories—but only if you keep listening. When you read your YouTube data weekly and act on it consistently, you’ll see the shift: content decisions will stop being guesses and start being data-driven instincts.
Advanced analytics and pro tips
Once you’ve mastered the basics—CTR, retention, watch time—it’s time to play in the deeper end of YouTube analytics. This is where marketers stop “checking metrics” and start engineering growth. The data you already have can forecast trends, uncover audience patterns, and guide creative strategy before a single second of video is shot.
1. Cohort analysis: watch behavior over time
Not all viewers behave the same way, and not all attention lasts equally. Cohort analysis groups your viewers based on when they first discovered your channel—last week, last month, last quarter—and tracks how their engagement changes over time.
Here’s what you might discover:
- Viewers acquired from a viral video might have low long-term loyalty.
- Subscribers gained through educational content might stay active longer and watch more videos per session.
- Seasonal traffic (for example, product launch months) could yield temporary spikes but weak retention later.
By analyzing cohorts, you can identify which campaigns build durable audiences—not just bursts of attention. Marketers use this to decide where to invest creative energy and ad budgets next quarter.
2. Custom dashboards and calculated metrics
The Advanced Mode in YouTube Studio is powerful, but it’s still limited. You can export data into Google Sheets or integrate through the YouTube Analytics API (and through platforms like Sociality.io) to build custom dashboards.
Calculated metrics—like “watch time per impression” or “engagement per 1,000 views”—reveal far more insight than single data points. For example:
- Watch time per impression = how efficiently thumbnails and titles translate into real viewing time.
- Engagement per 1,000 views = a better measure of community strength than total likes.
Once you combine these calculated KPIs with trend lines, you’ll start predicting performance instead of just measuring it.
3. Attribution modeling: the path to conversion
YouTube is often the first touchpoint, not the last. Viewers might discover your brand through a tutorial, then convert later via a retargeting ad or your website. Attribution modeling connects those dots.
When paired with Google Analytics or your CRM, you can map where YouTube fits in your funnel—awareness, engagement, or conversion.
- First-touch attribution: YouTube brings the audience in.
- Last-touch attribution: A YouTube video directly drives a click, lead, or sale.
- Multi-touch attribution: YouTube contributes to a broader decision journey alongside other channels.
Marketers who report with this clarity can prove ROI—not just reach.
4. Predictive insights and forecasting
Patterns in your analytics can be used to forecast results. If your channel grows 10% month-over-month in watch time, and RPM (revenue per 1,000 views) holds steady, you can roughly project next quarter’s revenue.
In Sociality.io, you can connect pages and review YouTube trends such as views, engagements, campaign performance, and post-level results to inform future planning.
You can also layer in keyword trends from YouTube’s Research tab to anticipate audience demand. If search interest for a topic grows week over week, get your content out early—timing can be worth thousands of impressions.
5. Audience clustering and segmentation
Inside the Audience tab, metrics like returning viewers, active times, and geography can be used to segment your audience by behavior rather than demographics.
For example:
- Loyal core: Watches multiple videos weekly, drives comments, and stays till the end.
- Casual explorers: Arrive via Suggested videos but rarely subscribe.
- Niche fans: Engage with specific topics or series only.
Each cluster needs different content frequency and tone. Loyal fans thrive on series and updates; explorers prefer short, high-impact content that’s easy to binge; niche fans respond to depth and detail.
Understanding these clusters allows you to tailor not just creative, but community-building tactics—like playlists, membership perks, and comment interactions.
6. Region and language splits
If your top territories change—say, your viewership from Turkey or Brazil doubles—you may need new subtitles, voiceovers, or culturally relevant thumbnails. Analytics can show where localization drives measurable ROI.
Marketers who internationalize early tend to outperform later because YouTube automatically recommends content by region. Even adding captions in one additional language can widen discovery by 5–10%.
7. Using experiments to validate strategy
Every major creator tests. It’s how they stay ahead of algorithms and trends.
Run small, structured experiments:
- Change your video hook style for one month (question vs. bold statement).
- Test video length (5-min vs. 10-min) for identical topics.
- Vary posting days (weekday vs. weekend).
Compare performance using consistent metrics—CTR, watch time, retention. After four to six tests, you’ll have a blueprint backed by real audience data.
8. Integrate off-platform data for the full picture
YouTube doesn’t live in isolation. Pair your analytics with website conversions, newsletter sign-ups, or e-commerce data. The combination reveals intent beyond views.
For instance:
- A tutorial might show modest CTR but high assisted conversions via your website.
- A thought-leadership video might boost branded search traffic.
- A campaign recap might not rack up views, but increases average watch time and subscriber loyalty.
When you measure across platforms, you stop optimizing for metrics—and start optimizing for outcomes.
9. Automate reporting and insight generation
Marketers spend too much time collecting data and not enough time interpreting it. In Sociality.io, a dashboard helps you visualize trends across summary KPIs, traffic sources, campaign analytics, and post-level metrics—so you can focus on insights instead of manual compilation.
Set automatic alerts for:
- CTR dropping below threshold
- Sudden dips in audience retention
- Engagement rate changes after uploads
Automation turns analytics into an early warning system—so you can act before performance declines.
10. Use analytics as creative fuel
This might sound counterintuitive, but creativity thrives on data. YouTube analytics doesn’t replace instinct—it sharpens it.
When you know which topics hold attention, which hooks drive replays, and which formats spark comments, your creative process becomes focused without losing imagination. It’s the bridge between art and algorithm.
The best marketers don’t fear analytics—they listen to it. They know each curve, spike, and CTR shift tells them something about how people think, scroll, and choose to spend their time.
FAQs about YouTube analytics
Future trends and what’s next
YouTube in 2025 isn’t just a video platform—it’s an evolving ecosystem of discovery, community, and commerce. The way marketers read analytics today will shape how they adapt to what’s coming next.
1. Shorts dominance continues, but depth wins.
Short-form keeps exploding, but YouTube’s algorithm increasingly rewards creators who use Shorts to lead into long-form content. Expect more hybrid strategies—snackable entry points paired with depth-driven storytelling.
2. Smarter analytics powered by AI.
YouTube is expanding predictive analytics—automatically surfacing which videos are likely to perform well or when your audience might peak. In 2025 and beyond, marketers will rely on these “recommendation hints” inside Studio for faster decisions.
3. Monetization diversification.
Ad revenue is stabilizing, but creators and brands are leaning more on memberships, affiliates, and sponsorships. Analytics will start blending these income streams to show total content ROI—not just CPM.
4. Cross-platform attribution.
Viewers don’t live in silos anymore. They discover a brand on TikTok, watch on YouTube, and convert on LinkedIn. The next evolution of social media analytics—already possible in Sociality.io—is unified measurement across platforms. You’ll see not only what performed but where it started.
5. AI-powered content optimization.
We’re entering an era where AI can predict retention dips before you publish. By analyzing patterns across scripts, hooks, and pacing, predictive tools will help marketers refine videos during production—not after.
The line between creativity and analytics will blur further—and that’s good news. Because when you understand the numbers behind attention, you can tell stories that last longer than a trend cycle.
YouTube analytics glossary 💫
| Term | Definition | Why it matters / How to act |
|---|---|---|
| Impressions | Times your thumbnail was shown on YouTube surfaces. | Low CTR with high impressions → refresh title/thumbnail; test contrast and 3–5 word overlays. |
| CTR (Click-Through Rate) | % of impressions that became views. | Pair CTR with AVD/retention; high CTR + low retention = mismatched promise—tighten first 10 seconds. |
| Views | Qualified plays that meet YouTube’s criteria. | Track alongside watch time; optimize intros to reduce early bounces. |
| Unique viewers | Estimated individuals who watched in a period. | Gauges true reach; combine with subscribers gained to judge acquisition efficiency. |
| Watch time | Total minutes/hours watched. | Core ranking signal; build series/playlists to extend session time. |
| AVD (Average View Duration) | Average minutes watched per view. | Raise by front-loading value, tighter edits, and pattern interrupts every 20–40 seconds. |
| APV (Average Percentage Viewed) | % of a video watched on average. | Aim ≥60–70% for ≤5-min videos; ≥50% for longer; compare by format/topic. |
| Retention curve | Graph of viewer stickiness over time. | Identify drop-off moments; rewrite hooks; replicate spikes where viewers rewind. |
| Traffic sources | Where views originate (Search, Suggested, Browse, External, etc.). | Balance Search (intent) with Suggested (discovery); tailor metadata and end-screens. |
| Impressions→Watch-time conversion | How well clicks convert into minutes watched. | KPI for thumbnail honesty and pacing; optimize until both CTR and AVD rise together. |
| Returning vs. new viewers | Loyalty vs. acquisition split. | Create series for returners; Shorts/high-intent keywords for new viewers. |
| Subscriber growth | Net subs over time/by video. | Study videos that drive subs; reuse structure, topic, and CTAs. |
| Monetized playbacks | Views that showed ≥1 ad. | Monitor alongside RPM; check eligibility/ad-friendliness if rate drops. |
| CPM | Advertiser cost per 1,000 ad impressions. | Context for niche value; doesn’t equal your earnings—use RPM for that. |
| RPM | Revenue per 1,000 views (your share). | Best profitability gauge; raise via longer watch time, back catalog, and end-screen flow. |
| End-screen CTR | % clicks on end-screen elements. | Keep to 1–2 focused CTAs; align next video with the last topic minute. |
| Card CTR | % clicks on info cards mid-video. | Trigger cards at natural curiosity peaks; avoid early clutter. |
| Shorts vs. long-form | Vertical ≤60s vs. standard videos. | Use Shorts for reach; convert with long-form; analyze separately to avoid skewed averages. |
| Research tab | In-Studio search demand and content gaps. | Prioritize topics with “High” demand + “Few results”; schedule quickly. |
| External referrers | Off-YouTube sources (sites, socials, embeds). | Track campaigns; add UTM params; ensure embeds point to playlists for chaining. |
| Playlists | Curated video groups that auto-play. | Increase session time; theme by intent stage (How-to, Reviews, Case studies). |
Wrapping up: Turning data into growth
YouTube analytics isn’t about collecting dashboards—it’s about listening to your audience through data.
Every impression, click, and second watched is feedback, showing you what resonates and what fades.
So before your next upload, open your analytics and ask:
- What made people stay last time?
- When did they tune out?
- What sparked the most conversation?
Then act on it. Adjust, refine, test again.
Because growth on YouTube isn’t random—it’s earned through attention, iteration, and understanding.
And with platforms like Sociality.io, you’ll spend less time decoding data and more time crafting the stories that keep audiences watching.
That’s the difference between channels that post videos—and brands that build momentum.