

LinkedIn Analytics: 2026 guide to metrics, insights, and tools for growth
Summarize this article via
LinkedIn analytics will be your operating system for LinkedIn: it tells you what works, what doesn’t, what wastes budget, and where to double down.
To perfectly comprehend the tips and tricks about LinkedIn analytics, you’d better know the latest updates with the platform and what LinkedIn exactly offers.
TL;DR: Grab the highlights and go
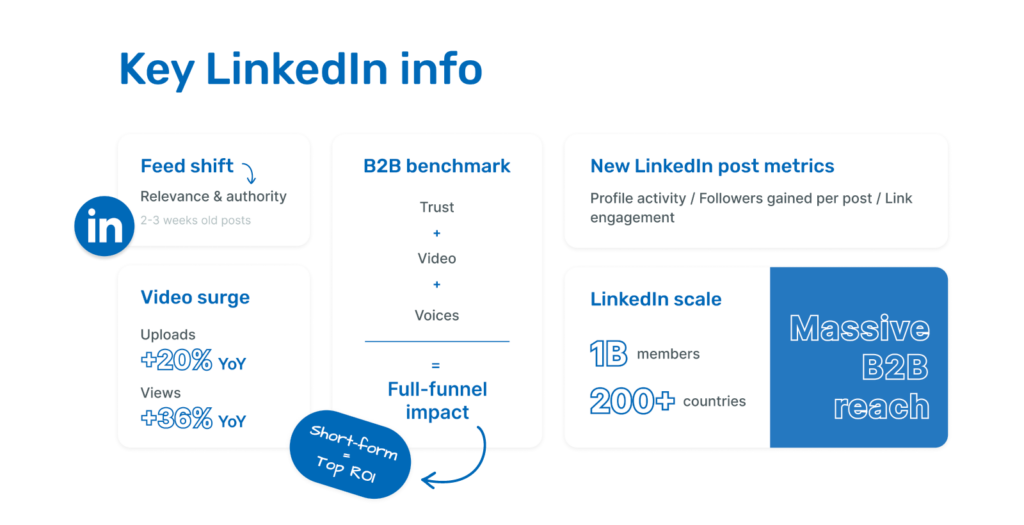
- LinkedIn’s feed now surfaces older but more relevant posts (often 2–3 weeks old), shifting success toward authority and outcomes over raw recency.
- Videos on LinkedIn are surging: uploads +20% YoY and views +36% YoY as LinkedIn expands creator-led series and video ad inventory.
- 2025 B2B benchmark: trust + video + influential voices drive full-funnel impact; short-form formats are leading ROI.
- New post-level insights—profile activity, followers from post, and link engagement—help tie content directly to outcomes.
- Building strong reports is a must, so use 28–42 day windows, add UTMs for attribution, compare deltas over time, and highlight clear wins, losses, and next tests.
- Platform scale: 1B members across 200+ countries; immense B2B reach when you get LinkedIn analytics right.
- Hashtag analytics require exports and third-party social media analytics tools since LinkedIn offers no native dashboard.
- Run experiments with posting timing, hooks, CTAs, and content formats to refine strategy.
- Use third-party tools like Sociality.io to centralize publishing, analytics, and social listening(We’re already helping 2,000+ marketers manage LinkedIn performance in one streamlined workflow!) If you want proof, check out how Sociality.io performs among Hootsuite alternatives.
If you are thirsty for more, get ready because in this blog post, I’ll help you turn LinkedIn analytics, one of the most important parts of social media analytics, into actionable decisions.
And they are all grounded in fresh data, actionable frameworks, and a Sociality.io workflow you can actually ship.
- LinkedIn analytics explained: What it is and why it matters
- LinkedIn metrics to track: The definitive roster in 2026
- How to use LinkedIn analytics for growth
- How to build a LinkedIn analytics report stakeholders love
- The 2025 algorithm shift: What to change in your content and your LinkedIn analytics
- LinkedIn analytics: Page-by-page
- LinkedIn analytics tool for B2B success
- Wrap-up
LinkedIn analytics explained: What it is and why it matters
At its core, LinkedIn analytics is the platform’s built-in measurement system. You’ll find dashboards for company pages, creator profiles, and post-level insights that reveal how your content performs. When you use them well, they go far beyond vanity metrics like likes. They show you:
- Who your audience really is
- How your content supports the funnel
- Where your focus should be
Of course, the native tool has its limits. For example, data history is capped, everything runs on UTC, and there’s often a lag. You can export results to dig deeper, but it’s not a true BI solution. This is where UTM parameters become non-negotiable. 🙅♀️
So, by tagging your links, you can track what happens once people leave LinkedIn and see the real business impact of your campaigns.
Last but not least, context matters a lot. Since mid-2025, LinkedIn’s algorithm has undergone a shift. The feed no longer rewards sheer posting frequency or recency. Instead, it surfaces content that shows expertise, authority, and relevance—even if it’s a few weeks old.
And your LinkedIn analytics should reflect this by tracking long-tail performance, not just the first week of a post’s life.
Where to access LinkedIn analytics (step-by-step)
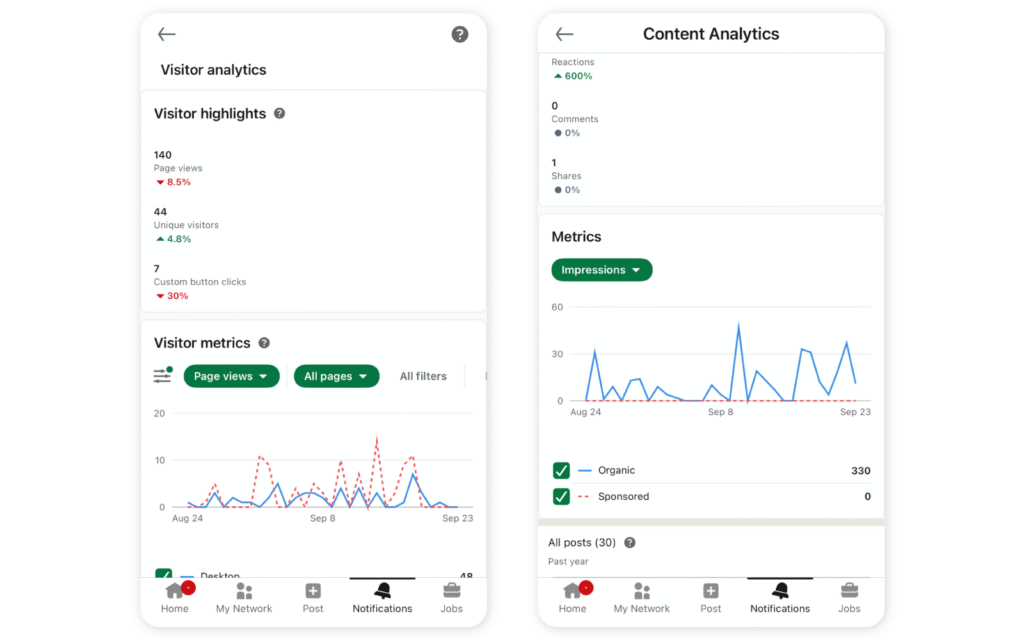
- Company pages: Page → Analytics (Visitors, Updates, Followers, Competitors, Leads, Employee advocacy). These dashboards give you who is seeing your content, how they engage, and how your page is growing. This is pretty standard across company pages. 👌
- Creator profiles: Post → View analytics for impressions, engagement, now with Profile activity, Followers from post, and Link engagement for Premium users. Also, some search appearance data appears here: what job titles or keywords people searched to find you. 🔎
LinkedIn metrics to track: The definitive roster in 2026
When it comes to proving ROI and refining your strategy, not all numbers are created equal. Some LinkedIn metrics tell you everything about performance, while others are just noise.
Below are the ones that really matter right now in 2026:
Not every metric here applies the same way to a company page and a personal profile. A company page dashboard leans on visitor and follower data because it’s built for reach and pipeline; a personal profile leans on profile views and search appearances because it’s built around one person’s reputation. Skim this roster with your own account type in mind, then dig into whichever section matches what you’re actually running.
Engagement rate (the heartbeat metric)
Engagement rate is the share of your impressions that turned into a reaction, comment, share, click, save, or send. Add up those actions, divide by impressions, and you have the single number most reporting templates lead with.
LinkedIn folded two new actions into that mix in September 2025: saves and sends. A save means someone bookmarked your post to find again later, a stronger signal of intent than a quick like. A send means someone forwarded it to a colleague or connection through LinkedIn’s own messaging, about as close to a personal recommendation as this platform gets. Neither shows up in the classic reactions-and-comments tally, so if your engagement rate formula predates September 2025, it’s undercounting.
Saves and sends (added 2025)
In September 2025, LinkedIn added saves and sends as two new actions in post analytics. Both live in the same “Engagements” panel as reactions, comments, and reposts, so you don’t need a separate report to see them.
Track saves when you want to know which posts people plan to come back to — how-to threads, templates, and reference lists tend to collect the most. Track sends when you want to know which posts people trust enough to put their own name behind by forwarding them. A post with modest reactions but a high send count is often working harder for your brand than the numbers on the surface suggest. LinkedIn confirmed the rollout in September 2025.
Impressions and reach for visibility
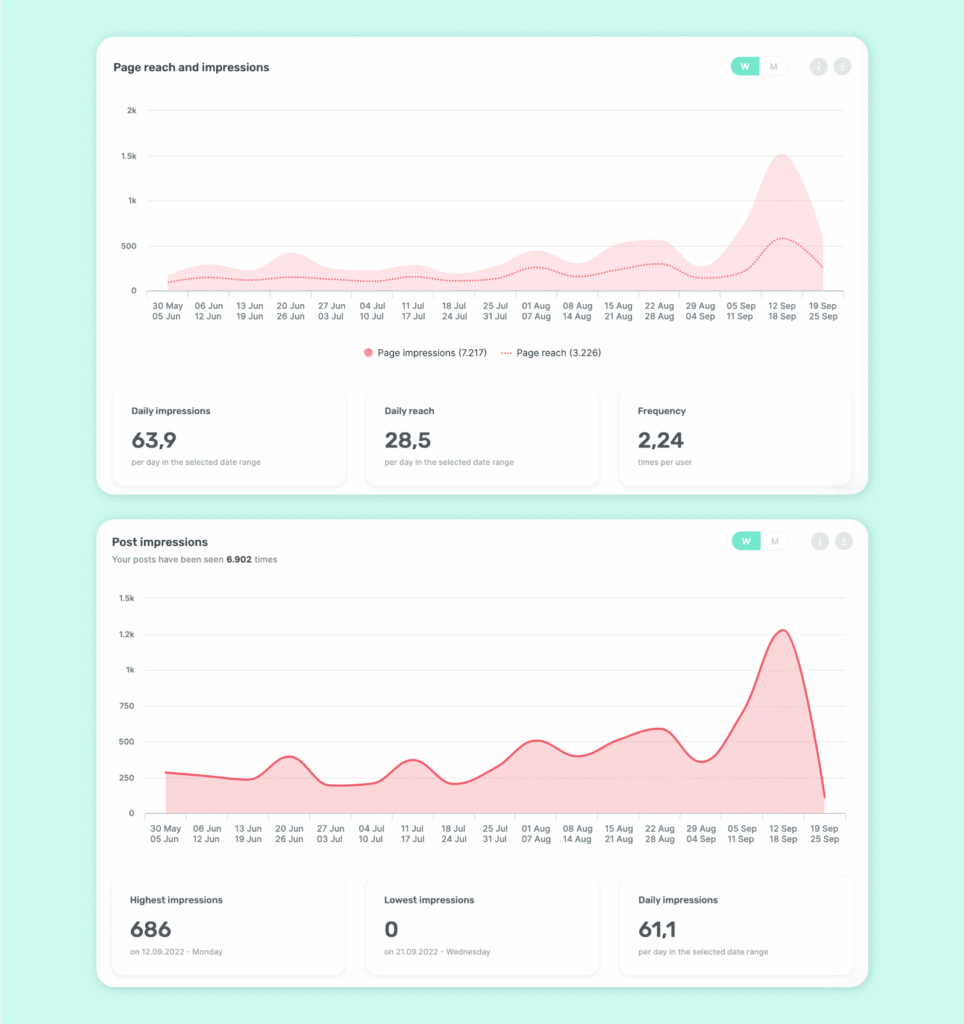
Impressions show how many times content is served in feeds; unique reach (or “unique impressions”) shows how many people saw it.
Both are useful: Impressions highlight visibility volume, and reach shows breadth. If reach is low vs. impressions, it means your content is showing repeatedly to the same audience rather than expanding.
Click-through rate (CTR) and link engagement
CTR = link clicks ÷ impressions
What makes this metric powerful in 2025 is that link engagement at the post level is now usable in a way it wasn’t before. If your post links are buried or your CTA is weak, people won’t click—and you might never know.
To improve, place links early (above the fold), use a clear, single CTA, and test variations.
Follower growth and follower quality
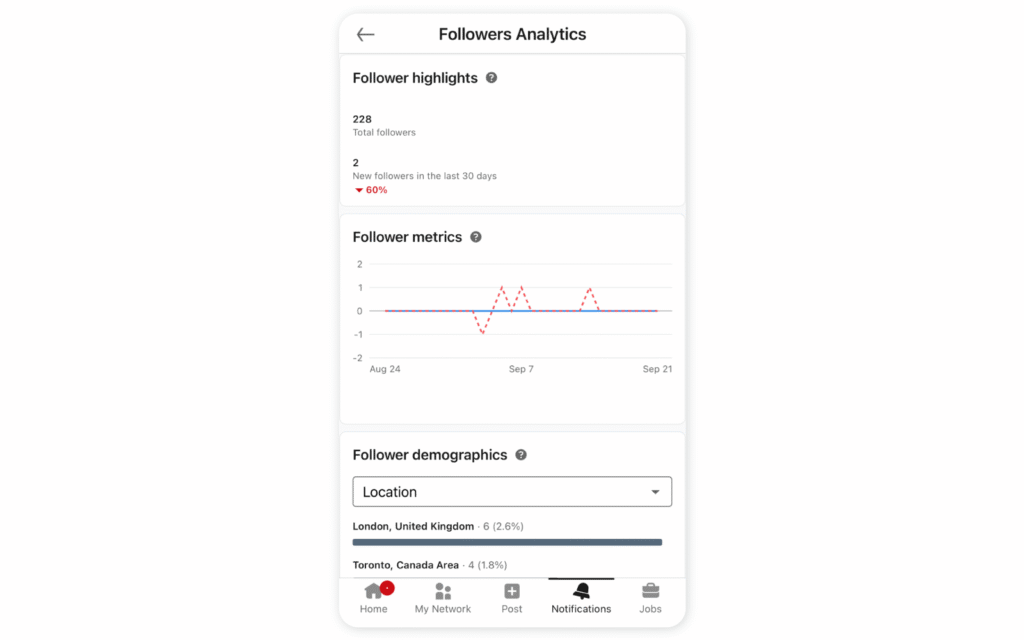
Tracking net new followers is basic. What matters more now is who those followers are.
👉Are they coming from organic discovery, via posts, or through invites?
👉Are they aligned with your ideal customer profile (ICP) in terms of seniority, industry, and location?
Demographic insights are especially useful—a recent update from Hootsuite shows growing diversity across job titles, age groups, and geographies on LinkedIn, which means you should segment more carefully.
Profile activity & outcomes (new)
One of the most valuable additions in 2025 is the ability to connect specific posts to profile activity. You can now see which updates led to profile views and which ones brought in new followers.
This helps you separate “relationship-building” content — narratives, case studies, behind-the-scenes posts — from “click-through” content like links or offers. Both have value, but the outcomes are different. With this metric, you finally have the data to balance the two intentionally instead of guessing.
Page views and button clicks
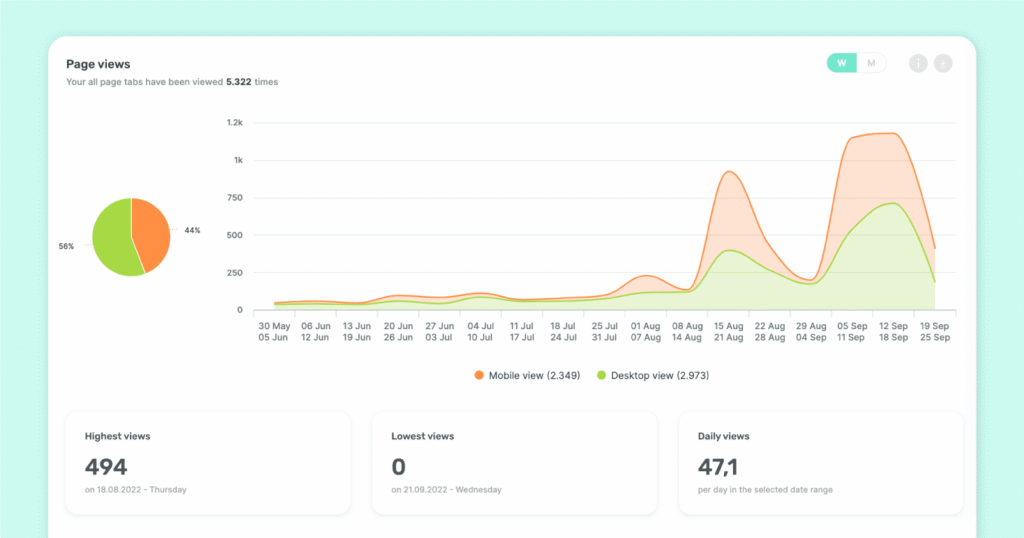
In LinkedIn page analytics, you should pay close attention to page views and the clicks on your action buttons. “Visit website,” “Contact us,” and other featured actions are bottom-funnel intent signals. They show when someone has moved beyond consuming content and is ready to explore or engage further.
Reporting these numbers alongside impressions and engagement helps you show not just reach, but meaningful micro-conversions that bring people closer to your business.
Video views and retention
With video momentum (and BrandLink expansion), monitor views, average watch time, and completion rate. Short-form is leading ROI in B2B per LinkedIn/Ipsos; reflect that in “analytics LinkedIn” dashboards.
Top posts, formats, and cadence
Your best insights often come from patterns, not single posts. LinkedIn post analytics makes it easier to see which formats consistently deliver.
🟢Carousels tend to drive depth
🟢Native documents are often saved for later
🟢Vertical video expands reach
🟢Polls invite quick interaction while doubling as market research
When you tag and track these patterns over time, you can spot the formats that anchor your strategy instead of chasing one-off spikes.
Competitor benchmarking
Comparing follower growth, post volume, and engagement rates against similar pages helps you gauge what’s realistic in your industry. If your growth looks flat in isolation but aligns with broader trends, you know it’s the market, not the message. And if peers are pulling ahead, the data tells you it’s time to refine your mix.
Leads & lead gen forms (paid and organic)
Lead gen forms are where you stop measuring attention and start measuring pipeline.
Open rate tells you whether the offer resonates, completion rate shows where friction lives, and CPL reveals if it’s worth the budget.
If you see a 70% open rate but only 20% completion, the friction is inside the form — maybe it’s too long or asks for details people won’t share.
Layer in post-view or profile-view upticks to see the secondary signals a form creates. Paid and organic need to sit in the same report; otherwise, you miss the full story of what’s actually driving leads. 😱
Employee advocacy
Company pages can only go so far on their own. When employees share content, it often lands better — and travels further — than the same update from the brand.
Tracking recommended shares and the engagement they spark is still one of the simplest ways to prove extended reach. The model hasn’t changed, but you can modernize it. Spotlight the best-performing employee post each month, share why it worked, and encourage others to replicate it. Authentic voices scale impact in a way corporate ones rarely can.
Search appearances (discoverability at a glance)
Search appearances don’t get enough credit. This metric shows how often your profile pops up in LinkedIn search and what job titles or keywords are tied to it. It’s LinkedIn’s version of organic visibility.
If the terms line up with how you want to be positioned, you know your profile is doing its job. If not, it’s a signal to tighten your headline, summary, or content focus so the right people can actually find you.
How to use LinkedIn analytics for growth
I benefited a lot from the video above while creating this section. If you have 8 minutes, I highly recommend watching it. If you only have 1 minute, here’s my roadmap for LinkedIn growth:
👉Start with frequency. Don’t wait until the end of the quarter—check your analytics weekly or at least twice a month. That way, you can adjust before momentum is lost.
👉Look at the post impressions to see how visible your content really is. Follower metrics reveal who’s joining your audience, and the demographics behind them—industries, roles, seniority, company size—tell you if you’re reaching the right people. Profile views are another underrated growth lever. Treat your profile like a landing page, and when someone visits, consider sending them a message, a connection request, or simply acknowledging their interest. By doing so, you’ll turn analytics into relationships.
👉Don’t forget to repurpose your content. Save your best-performing posts in a spreadsheet or Notion database, then repackage or expand on those ideas. If a post struck a chord six months ago, chances are it can do the same again today with a fresh spin.
👉Follower demographics also guide content direction. If you see a surge of people from a specific industry or role, tailor posts that speak directly to their challenges. Likewise, search appearances show which keywords or job titles you’re being discovered for—data you can use to sharpen your positioning.
LinkedIn hashtag analytics: How to actually use them for your benefit
Native doesn’t offer a dedicated LinkedIn hashtag dashboard, but you can:
1)Tag posts consistently
2) Track performance by hashtag in exports
3) Evaluate discoverability via non-follower impressions
4) Use third-party LinkedIn analytics tools (your LinkedIn marketing journey begins now with a 14-day free trial) to tag and compare hashtagged content over time.
How to build a LinkedIn analytics report stakeholders love
LinkedIn gives you two different native reports here, and mixing them up is the fastest way to confuse a stakeholder meeting. The Pages Report covers organic performance — impressions, engagement, follower growth, the numbers your content earned on its own. The Paid Performance Report covers everything running through Campaign Manager. Pull both before you write a single sentence of narrative, or you’ll end up crediting organic content for reach that ads actually bought.
- Pick goals, then metrics
Awareness → impressions, unique reach, video views.
Consideration → CTR, average watch time, and saves.
Pipeline → lead form metrics, meeting-worthy profile views.
- Set time windows for the 2025 feed
Because relevance de-prioritizes recency, track 28–42 day windows to capture slow-burn posts.
- Export, annotate, attribute
Export native analytics and append UTMs so GA captures assisted conversions. Wide Angle stresses UTMs to fix attribution gaps.
- Present insights, not screenshots
Use deltas vs. prior period, spotlight 3 winners/1 loser, and give a test you’ll run next cycle (hook, headline, format, or posting time).
LinkedIn analytics reporting template
A good LinkedIn analytics report should tell a story, not drown people in numbers. Structure it around goals — awareness, consideration, pipeline — so every metric has context.
Each row can become a slide, a dashboard card, or a section in your monthly summary. Add top-post screenshots, quick notes on why they worked, and close with one experiment for next cycle.
Here’s the exemplary one I’ve filled in for you:
| Goal | Metrics to Track | Insights to Add | Next Action |
| Awareness | Impressions, Unique Reach, Video Views | Which formats or topics drove the most reach? Any spikes/drops worth noting? | Double down on content that delivered broad reach. Optimize weak formats. |
| Consideration | CTR, Avg Watch Time, Saves | Which posts triggered clicks or saves? Any patterns by format or posting time? | Test new hooks/CTAs, refine video length, and optimize carousel/doc storytelling. |
| Pipeline | Lead Form Completions, CPL, Profile Views | Which campaigns/posts brought qualified leads or profile visits from ICPs? | Replicate top-performing campaigns, adjust targeting, pause underperformers. |
| Engagement | Reactions, Comments, Shares, Engagement Rate | Which topics generated conversations and community engagement? | Create follow-up posts, reply to comments, and fuel discussions that worked. |
| Competitors | Follower Growth, Post Volume, Engagement Rate | How are you pacing against competitors in growth and engagement? | Adjust posting cadence or format mix to close performance gaps. |
The 2025 algorithm shift: What to change in your content and your LinkedIn analytics
The way LinkedIn distributes content has changed. The feed no longer rewards only the newest posts but increasingly surfaces content that proves its relevance and authority over time.
This means your analytics need to look beyond week one. Posts often continue gaining traction for two to three weeks, so measure performance at day seven and again at day 21 to capture the long-tail lift that matters.
Trust signals now carry more weight than quick engagement. Saves, profile visits, and new followers are proof that your content is useful, credible, and worth returning to. Folding these into your LinkedIn analytics reports helps you move beyond vanity metrics and show outcomes that actually build relationships.
Finally, video continues to dominate the platform. With uploads and views rising sharply year over year, LinkedIn is rewarding short-form, engaging formats. Experiment with these:
- Quick explainers
- Behind-the-scenes CEO insights
- Product demo teasers
Track them closely with watch-time quartiles and completion rates. It’s not about who clicked play — it’s about how long they stayed.
LinkedIn analytics: Page-by-page
LinkedIn’s Page Analytics hasn’t changed much in structure, but you should rethink how you use each section.
“Visitors” is still one of the most valuable dashboards for audience insights. You should go beyond the basics of seniority, job function, location, and company size. Pay attention to non-follower reach to understand how often new people discover your page, and check device splits to see where your content is consumed. If most of your traffic is mobile, you need to design with smaller screens in mind.
“Updates” is where you should stop thinking in terms of impressions alone. You can group posts by format — video, doc, carousel, or text — and by intent: are you telling, teaching, or triggering? You should then track engagement rate, CTR, average watch time, and followers gained per post. This approach will show you which types of content actually move the needle instead of just filling the feed.
“Followers” shouldn’t be treated as a vanity metric. You should track net new followers, but also understand where they come from: organic reach, invitations, or specific posts. More importantly, you need to measure whether they align with your ICP. A monthly snapshot of your follower analytics, paired with competitor pace, gives you the context to know if you’re growing in the right direction.
In “Competitors”, you shouldn’t obsess over copying what others do. You should use their post volume, engagement rates, and format mix as a benchmark to identify opportunities. If your competitors are leaning on carousels while your videos outperform, you should recognize that as a differentiator, not a gap.
“Leads” is the section where you can’t afford to stay surface-level. You should tie every completion back to the creative, the audience, and the offer. Tracking the path from a form being opened to actually submitted — and then looking at profile activity that follows — will help you prove that LinkedIn is not just generating clicks but actual business opportunities.
“Employee advocacy” is often overlooked, but you should lean into it more. Recommending content for employees to share still works, but you can go further by highlighting the best-performing employee post each month. You should analyze why it resonated and scale those lessons across your team. This not only grows your reach but also strengthens your culture.
Practical playbooks (Ready-to-test experiments?)
Experiments are where LinkedIn analytics comes alive. Instead of guessing, you test, measure, and adjust. These playbooks are simple to run, but powerful when you repeat them consistently.
So, I highly suggest starting with posting cadence and timing. Publish two to five posts a week and watch how engagement shifts by day and format. Over time, you’ll see patterns emerge.
Maybe videos get traction midweek while text posts perform better on Mondays. Forget generic “best time to post” charts; your own data will always tell the truth. 🩵
Headlines and hooks are another easy test:
- A/B the first 90 characters or move the call-to-action around.
- Then track click-through rate and link engagement over a month.
It’s often the small changes at the top of a post that decide whether someone scrolls past or leans in.
You can think of your content as a portfolio. A balanced mix usually outperforms a one-note feed.
Then, why don’t you try a weekly rhythm of one video, one carousel or document, one text POV, and one customer story? Then look at engagement rate, watch time, saves, and followers gained per post.
LinkedIn analytics tool for B2B success
Choosing between these usually comes down to one question: do you need LinkedIn analytics alone, or LinkedIn analytics next to every other channel you run? Here’s how the main options split on that, plus a few other things worth checking before you commit.
| Tool | Best for | Native LinkedIn data depth | Cross-platform reporting | Pricing |
|---|---|---|---|---|
| LinkedIn native analytics | Quick checks inside the platform you’re already using | Full, but capped history and UTC timestamps | None — LinkedIn only | Free |
| Sociality.io | Teams reporting across LinkedIn and other channels from one dashboard | Full native metrics plus unified cross-channel views | Yes | See current pricing |
| Sprout Social | Larger teams needing built-in social listening alongside analytics | Full | Yes | See current pricing |
| Hootsuite | Teams already standardized on Hootsuite for scheduling | Full | Yes | See current pricing |
Drum roll, please.
🥁🥁🥁🥁🥁
Sociality.io it is!
So, managing a single LinkedIn page is already demanding, but managing LinkedIn alongside every other social channel your brand runs? 😬
Once you connect your LinkedIn account, publishing, analytics, listening, and reporting live in one place. You can schedule posts at the right time, collaborate with your team, and monitor growth across every channel without leaving the dashboard.
More than 2,000 marketers already use it daily — not because it looks good on paper, but because it saves hours and produces cleaner insights.
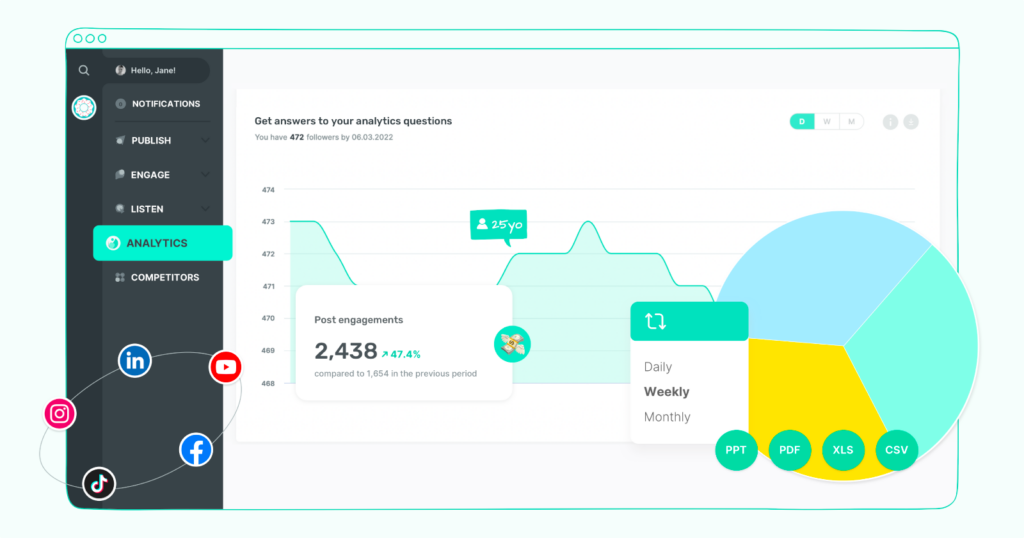
Analytics is where it really shines. Instead of bouncing between tabs, you get one LinkedIn analytics report with impressions, engagement rate, CTR, watch time, followers gained per post, and non-follower reach — broken down by format so you can see what truly resonates.
And our listening feature adds another layer. By tracking brand mentions and industry keywords, you catch the conversations that matter before they peak. Those signals feed straight into your content strategy, turning insights into timely posts that land. And collaboration isn’t an afterthought. Teams manage comment threads, set SLAs in the inbox, and share live dashboards with executives. Everyone works from the same source of truth.
So what does this look like in practice?
- Publishing: Queue posts and run small experiments with different hooks, CTAs, and formats.
- Analytics: Build reports that combine impressions, engagement rate, CTR, watch time, and followers gained — with non-follower reach layered in.
- Listening: Track your brand, industry keywords, and product mentions to surface new content ideas that audiences already care about.
- Collaboration: Keep discussions on-platform, manage your inbox with clear SLAs, and share dashboards with executives without exporting endless files.
FAQ about LinkedIn analytics
Wrap-up
Without measuring what matters, you risk wasting budget on impressions that don’t convert or posts that fade too quickly.
The 2025 landscape makes analytics non-negotiable. The feed rewards relevance and authority over recency, video has become the dominant format, and new post-level insights finally tie content to outcomes like profile activity, link clicks, and followers gained. Reporting can’t stop at likes and impressions anymore — it has to capture long-tail impact and prove business value.
The teams who win are the ones who track broadly — page, posts, followers, leads, employee advocacy — but report smartly. That means clear takeaways, actionable trends, and one or two experiments to test next.
And you don’t have to do it manually. Sociality.io brings everything into one place: publish at the right time, monitor growth across channels, analyze results with clarity, and benchmark competitors with confidence.
More than 2,000 marketers already use it to run LinkedIn strategies with less chaos and more clarity. When you centralize, you report like a pro, iterate faster than the timeline, and most importantly, turn analytics into outcomes.