Follower growth rate: How to calculate it & competitor benchmarks
Summarize this article via
Follower growth rate is the clearest signal of whether your audience is actually expanding, or just holding steady while the numbers sit still. And in 2026, the platform you’re on shapes how much tailwind you get: DataReportal puts global social media growth at roughly 5% a year, but that average hides a wide split. TikTok and YouTube are still pulling in audiences fast, while Facebook and X have largely flattened. Knowing your own rate and what “good” looks like on your network is how you tell real momentum from vanity.
This guide covers the formula, a worked example, what counts as a good rate on each platform in 2026, and how to track it over time for both your own accounts and your competitors.
Follower growth on social media is measured by dividing the net number of new followers/subscribers by the follower count at the starting date. Tracking follower growth helps you to measure your social media team’s efforts. Although follower growth on social media is considered a vanity metric, practically all social media teams include it in their KPIs.
What’s a good follower growth rate?
You can measure your own follower growth easily — even manually in a spreadsheet. The harder question is whether you’re growing at the right speed. There’s no universal “good” number: it depends on your platform, your account size, and your industry. But one factor shapes your ceiling more than any other — which platform you’re on. Global social media user growth is running at roughly 5% a year, and it’s far from even across networks (DataReportal, 2026):
Platform
Audience momentum in 2026
TikTok
Fastest-growing major network — still adding audience quickly
YouTube
Growing steadily; now the largest platform by reach
LinkedIn
Growing — strongest momentum among B2B networks
Instagram
Large and stable, with slower growth
Facebook
Mature — close to flat
X
Flat, with limited and declining transparency on growth
How to read these:
Smaller accounts grow faster. Growth rate slows as your audience gets bigger, so compare yourself to accounts in your size tier, not the platform-wide average.
Benchmarks are directional, not gospel. Providers measure follower growth on different bases — weekly, monthly, or yearly — and definitions vary widely, so treat these as a compass rather than a hard target.
Your own trend is the benchmark that matters most: are you accelerating, or coasting?
This is also where a dedicated tool earns its keep. Connect your accounts and your competitors in Sociality.io and you’ll see historical follower growth rates side by side in one chart — so “good” is measured against your real peers, not a generic industry average.
How to calculate follower growth rate? (formula + example)
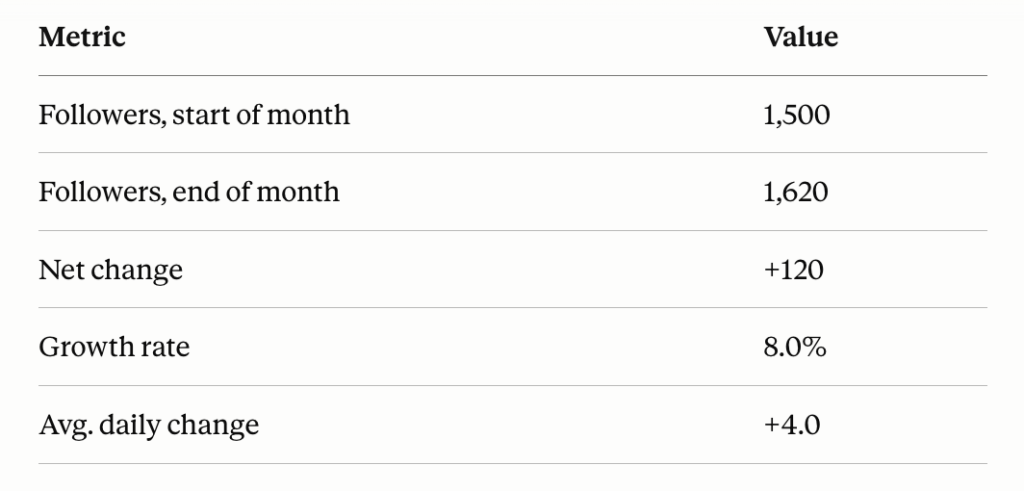
Follower growth rate tells you how fast your audience is expanding over a period, as a percentage. The formula is the same on every platform:
Example: you start the month with 30,000 followers and end with 35,000.
Net new followers: 35,000 − 30,000 = 5,000
Growth rate: (5,000 ÷ 30,000) × 100 = 16.7% for the month
Calculate it in three steps:
Pick your period (day, week, month, or quarter) and note your starting follower count.
Subtract the starting count from the ending count to get net new followers.
Divide net new followers by the starting count and multiply by 100.
Need a daily figure? Run the same formula over a single day — that’s your daily follower increase rate. Whenever you compare accounts or competitors, keep the period consistent.
Or skip the math entirely, and AI will handle it
If your accounts are already connected to Sociality.io, you don’t have to touch the formula at all. With the Sociality.io MCP, you can just ask your AI assistant, ChatGPT, Claude, or whichever you use, for the number in plain language. It reads the follower data straight from your connected accounts and hands back the rate for whatever platform you’re tracking. Try asking it something like:
“What was my follower growth rate on LinkedIn last month? Show my starting and ending follower counts and the percentage.“
Swap “LinkedIn” for any connected platform, Facebook, X, Instagram, TikTok, YouTube, or ask for all of them at once to compare.
Free tools to track follower net
Numerous social media analytics tools exist on the market that helps you to automate monitoring follower count for both your social profiles as well as the competitors’.
However, if you are tight on a budget, we have prepared a simple excel table for you. There are different views and allow you to track follower growth on a daily, weekly, monthly, and quarterly basis.
The problem of fake followers
Follower growth on social media often involves tremendous efforts from social media teams. Not only do they need to prepare content plans, engage with audiences, curate user-generated content, listen to sentiment analysis and monitor performance metrics, but they also run social media ads and conduct competitor analysis.
Thus, businesses often cut corners and purchase fake followers. If you want to learn more about fake followers and how to clean up your accounts, check out our article:How to clean up Instagram from bots and dead accounts?
How to track competitors’ followers’ growth rate on social media using Sociality.io
If you’d rather build your competitor report manually, the walkthrough below shows you how. To skip the setup, the Sociality.io MCP can do it for you, just ask your AI assistant to “compare my follower growth rate against my competitors this quarter,” and it builds the comparison right in the chat. Try it for free now. ❤️ It takes a minute to set up.
Choose all the relevant competitors whose follower growth you’d like to track. You can focus on one whose target audience intersects heavily with yours, but that won’t give you the full picture. Try to go for a few.
Step 2: Choose a social media platform
Now you need to pick the relevant social network: Facebook, Instagram, Twitter/X, or YouTube.
You can always return to this step if you’re interested in checking your competitors’ follower growth across different social networks.
One social network at a time just makes for a neater presentation and easier analysis.
Step 3: Set the time frame
Next, pick the period over which you want to track your competitors’ growth.
Choose a short one if you’re only interested in how your competitors’ following has grown recently. If you’re interested in seeing how it has grown over a long span of time, simply set the starting point farther back.
You can set the exact dates you want. But the preset options to the left are quick and handy if you’d like data on the past seven days, the past 30 days, the previous month, or the beginning of the year until now.
Step 4: Generate the report
After picking all the right filters and options to give you relevant results, you simply need to hit “Create” to start seeing the report.
This is where the fun begins.
Let’s go through all the data you’ll receive at this point and how it reveals your competitors’ growth rate.
For example purposes, we’ll be using relatable brands like Starbucks, Burger King, Tacobell, etc. You’ll know to substitute these with your actual direct and indirect competitors, no doubt.
And remember, if we’re just trying to figure out the growth rate and the dynamics of our competitors’ following, these methods work just the same—regardless of the exact target audience.
Competitor analysis report example
If you want o create your report on your own, you can find the steps below. But with Socialty MCP, all you’ll do is just tot askit.
Chart 1: Total Followers
If you’re going to be checking your competitors’ growth rate, it’s probably best to know how large their following is right now.
This is crucial. Without it, you won’t be able to tell what, say, an average follower growth rate of 400 users means in the context of the brand. If the brand has a few dozen followers, that’s a lot. If it has several thousand, it’s not as big a deal.
You’ll also get a lot of perspective from this if you’re analyzing multiple competitors simultaneously. It will give you a clear idea of how your competitors stack up against each other.
Chart 2: Followers
The Followers chart will show you how your competitors’ total following has changed over time.
Sure, this is an idea of the brand’s growth rate, but the data’s not immediately obvious. Knowing your competitors’ follower fluctuations is certainly important for other types of analysis. But when we’re specifically looking at the growth rate, we pay it a passing glance.
Chart 3: Growth of Followers
This is where you’ll want to pay most of your attention.
There’s a convenient line there (color schemes are changeable in settings), that helps you quickly separate between negative and positive growth.
Yet more, you can observe your competitors’ growth from day to day.
In short, the Growth of Followers chart is great for zooming in on interesting and significant periods, which can point to industry-wide trends.
Next comes the Growth Rate Summary Bar, which allows us to zoom out again and get a detailed snapshot.
Chart 4: Growth Rate Summary Bar
Look, now we can see:
Fan growth
Max. Daily Growth of Fans (your competitor’s best day)
Min. Daily Growth of Fans (your competitor’s worst day)
Daily Average of Growth of Fans
Pro tip: Check competitors’ growth rates automatically
Yes, automatically!
You can keep track of your competitors’ growth rate after only following these steps once. Just go back to the top and click the schedule icon.
You’ll then be able to schedule reports to be sent to your inbox automatically.
And at whatever frequency you like.
According to a Fluent analysis of 104 marketing agencies, only about one in three minutes of reporting time actually goes toward generating insight, the rest is spent pulling data, formatting, and reworking. We understand.
Automatic reports keep you efficient without breaking a sweat.
It’s as easy as just fetching your fully detailed report in your email.
That’s all you’ll need to do to check your competitors’ growth rate on social media. Just follow these four steps, with particular attention to the fourth, and you’re good to go!
You’ve got competitors whose growth rate you can figure out now, so we’ll leave you to it. Come back for more of our guides and insights.
Tawanda is a SaaS-focused content writer and brand journalist who uses data to uncover compelling narratives and actionable insights 🤓. He thrives in research rabbit holes and analysis corners📍—turning complex findings into clear, memorable stories that drive traffic, engagement, and user growth.