How to use Instagram analytics in 2026 (+ PDF checklist)
Summarize this article via
You must know what’s changed with Instagram analytics in 2026, whether you’re running a small shop, managing campaigns for clients, or scaling an enterprise team.
Views are now the common metric across formats, shares are stronger than likes, and original content gets priority in feeds.
In this guide, I’ll answer the key questions you must know:
- How do you actually read them?
- Which metrics really decide growth?
- How has the Instagram algorithm shifted in the past year?
- What should you track weekly vs. monthly?
- And most importantly, how do you turn numbers into a strategy?
I’ll share practical roadmaps for small businesses, agencies, and enterprise teams separately. Plus, you’ll have advanced practices like hashtag analytics, influencer measurement, cross-platform attribution, and a look at how a social media MCP can make Instagram reporting and analysis much less manual.
And because social media analytics tools matter, I’ll show you exactly where Instagram’s native Insights stop — and what you need to expand visibility and save hours.
I know some of you may be in a rush, so here’s the shortcut:
TL;DR or “just give me the key takeaways“
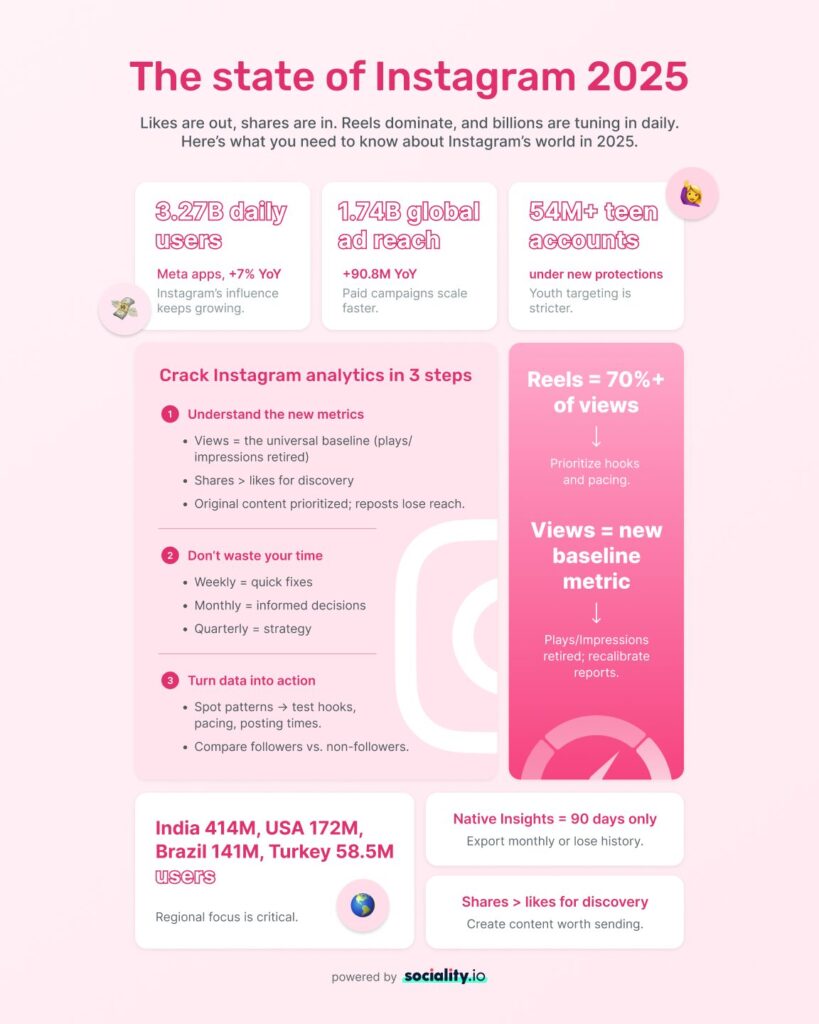
- Weekly = fixes, monthly = decisions, quarterly = strategy → Match report cadence.
- 3.27B daily users across Meta apps (+7% YoY) → Instagram’s influence keeps growing.
- Views = new baseline metric → Plays/Impressions retired; recalibrate reports.
- 1.74B global ad reach (+90.8M YoY) → Paid campaigns scale faster.
- $32.03B US ad revenue (+24.4% YoY) → Competition for ads is rising.
- Original > reposts → Smaller creators win more reach.
- India 414M, USA 172M, Brazil 141M, Turkey 58.5M users → Regional focus is critical.
- Shares > likes for discovery → Create content worth sending.
- Reels = 70%+ of views → Prioritize hooks and pacing.
- 54M+ teen accounts under protections → Youth targeting is stricter.
- Native Insights = 90 days only → Export monthly or lose history.
- Sociality.io unlocks deeper analytics + one-click reports → No per-user fees for enterprises.
- What is Instagram analytics?
- Why Instagram analytics matter (for real)
- How to see Instagram analytics
- What do Instagram analytics actually tell you?
- Common Instagram analytics mistakes
- Turning analytics into strategy
- Benchmarking & competitor analysis
- Small businesses
- Troubleshooting playbook: If X is down, do Y 💪
- Reporting & ROI
- Governance & data hygiene
- Industry-specific applications
What is Instagram analytics?
Instagram analytics shows you what happened after you posted, who responded, and whether your content actually did its job. Reach, views, saves, shares, profile visits, follower growth, and completion rates all help you understand what’s working and what’s not.
In simple terms, Instagram analytics tells you:
- How many people saw your content
- Whether they engaged with it
- What kept their attention
- If it led to follows, clicks, or conversions
Why Instagram analytics matter (for real)
If you don’t hold your Instagram analytics wheel, the algorithm will drive for you—and it won’t care where you end up.
In 2026, Instagram made one thing crystal clear: Views are the common language across formats, and content that people send (yes, those quiet DM shares) will travel further than anything built just to rack up likes.
Let’s make this practical. ✨
You’ll use analytics to answer three human questions:
- Who am I talking to?
- What actually worked?
- Did it reach new people or just my regulars?
That’s it. Not glamorous, but it will decide whether you grow.
Who am I talking to?
Your followers aren’t a blob. They’re clustered by age, location, and behavior. When you check the top cities and most active times, you stop posting when you have time and start posting when they show up. Tiny shift, huge ripple. You will feel the difference in the first 24 hours.
BONUS: If you are not sure how to benefit from all these and are not sure about your target audience, here’s what you should do:
@playbookshift How to define your target audience #socialmediamanager #socialmediaforserviceproviders #femalecoach #marketingstrategy #femaleentrepreneur #socialmediaforsmallbusiness #socialmediatips #socialmediastrategist #omnichannelmarketing #followerstoclients #howtogetclients #businesstips #targetaudience #idealclient ♬ original sound – Denise | Content Strategy
What actually worked?
Format tells the story: Reels are reach machines, carousels teach and make the audience save, and stories keep the relationship warm (and expose pacing sins instantly) while lives create a spike you can recycle later. Your job is not to love a format; your job is to read the pattern and feed the winner.
So, average watch time creeping up? Keep the hook. Story completion dipping? Cut the intro in half. Saves rising on how-tos? Make a series and add a CTA that actually asks for the save. Voila!
Did it reach new people or just my regulars?
Follower vs. non-follower is the underrated split.
-> If non-followers dominate, congrats, you cracked discovery; now add profile prompts so that attention turns into community.
->If followers carry the engagement, good, the bond is working; now create a shareable version (snappier, tighter, clearer payoff) so it can leave your circle. You will start writing for sends, not just hearts. You should.
Here’s the mindset I want you to steal:
- Social media analytics are not a trophy case. They’re a to-do list.
- You will not chase “viral.” You will chase clarity (hook), pacing (drop the filler), and intent (what should happen after the view).
- You should plan one-week experiments, not six-month doctrines. If the platform shifts, the audiences shift.
And yes, it can get messy when you’re running across multiple brands, languages, or regions. You probably don’t have six hours to sit there cross-checking follower activity against saves and sends for five different markets. Totally fair, and you shouldn’t.
What I suggest doing instead is pulling just the signals that matter, like views, follower vs. non-follower, sends-per-reach, story completion, and lining them up side by side before touching a brief. Ten minutes, tops. Then you’ll know where to put your energy.
Some weeks everything clicks, other weeks you’ll scrap and try again. Both are progress—because at least you’re not guessing.
And if you want to track and analyze Instagram analytics without killing time between tabs, Sociality.io puts deep analysis on one page. Quick and clean.
How to see Instagram analytics
How do you make sure you’re not missing the good stuff? How can you analyze Instagram accounts and get stats on Instagram?
Two paths here: Native Instagram Insights or a social media management tool like Sociality.io.
Native: Check your Instagram analytics on Instagram
If you’re using Instagram’s own analytics, here’s the deal:
- You need a Business or Creator account. Personal accounts don’t get Insights.
- Instagram only stores 90 days of data. If you don’t export monthly, you’ll lose history.
- As of 2026, everything is standardized into Views. Plays and Impressions are gone.
@sociallysimona How to check your Instagram analytics and use them to grow on the app ✨ #instagramtips #analytics #socialmediatips #contentcreatortips #creatorsearchinsights ♬ pop sound(1447969) – self-made project
How to check Instagram insights in 2026:
- Go to your profile.
- Tap the Professional Dashboard.
- Open Insights → then filter by content type (Posts, Stories, Reels, Lives).
- Drill down to see metrics like Reach, Views, Engagement, Completion rates, and more.
🌟Plus, don’t forget to export data every month if you want to compare quarter over quarter.
If you want to exceed the limits of native Instagram analytics, here’s what you need:
See Instagram analytics in AI tools like ChatGPT and Claude
With a social media MCP, you can connect your Instagram analytics to your favorite AI tools like ChatGPT or Claude and work with the data there. This takes a minute and means less copying, less pasting, and way less time rewriting the same context over and over again.
We, of course, suggest our Sociality.io MCP ❤️
Open your AI tool, authenticate once, and ask for what you need maybe a performance summary, or a competitor check, or maybe a faster explanation of what changed and why.
Now, there’s a much cleaner way to do this. Social media MCP works like the bridge between the AI tool and your real social media data, so the model works with actual context instead of just whatever you typed into the prompt.
If you want the full walkthrough, I’ve shared the step-by-step social media MCP setup in a minute for ChatGPT, Claude, and Codex in Sociality.io’s social media MCP guide.
Use a social media analytics tool like Sociality.io
On Instagram, you only see your own account, you lose history after 90 days, and reporting means screenshots or manual exports. 😬 But Sociality.io fixes that.
It tracks your biggest rivals so you can benchmark properly, gives you deep analytics for each post and campaign (views, reach, engagement types, follower vs. non-follower), and turns reports into a one-click job.
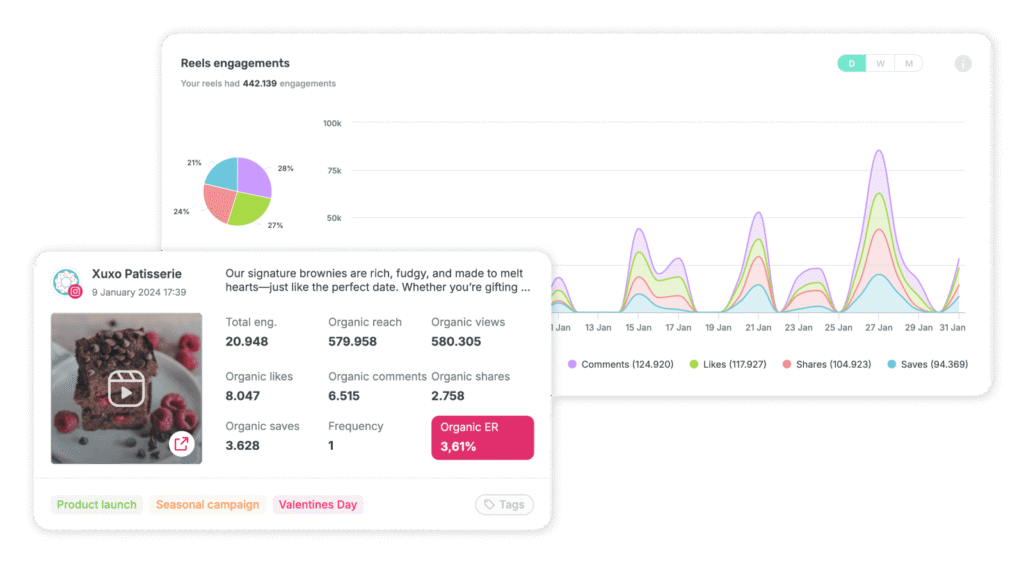
You’ll be checking your Instagram Reels analytics without a headache:
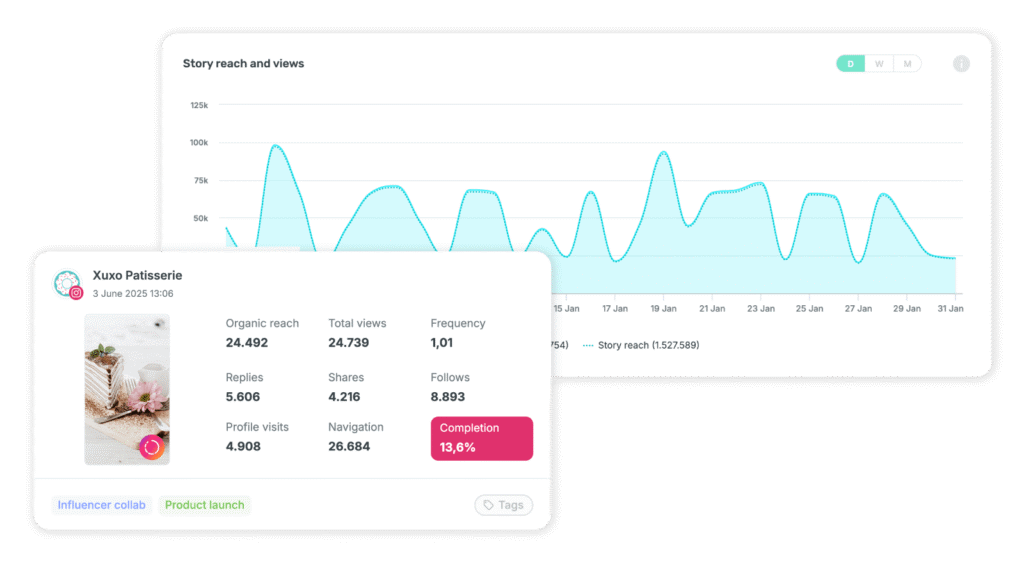
When you want to see how your Stories perform, their reach, views, and story-specifics like replies, shares, follows, reposts, and profile visits are right on your screen.
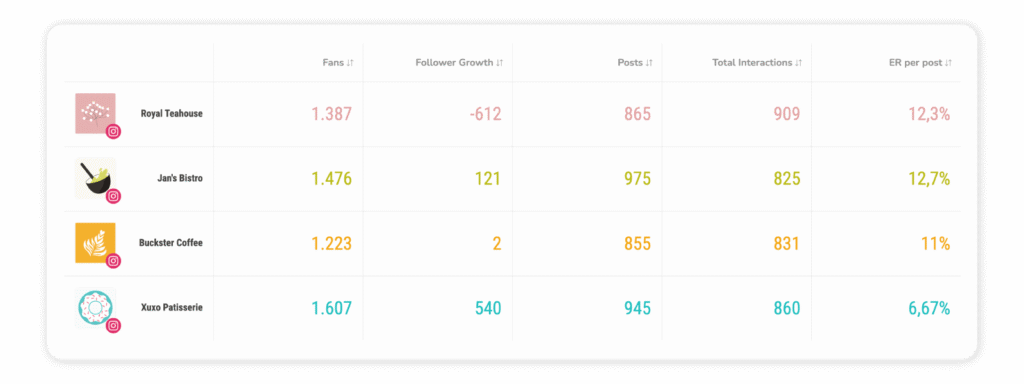
The moment you need to see your competitors’ analytics, it’ll be there for you. 🙂
🍒And here’s the cherry on top: If you’re running this at enterprise scale, there’s no “per-user” fee trap like you’ll see with tools such as Sprout.
How to get an Instagram Analytics report in Sociality.io
It’s literally a few clicks.
→ Connect your Instagram
→ Head to Analytics
→ Apply filters (date range, accounts, content type)
→ Hit Schedule Report.
Done. You’ll have a clean, ready-to-share report in your inbox—PDF, PPT, Excel—without touching a spreadsheet.
Also, reporting is getting more AI-assisted by default. 59.5% of marketers say they already use AI for analytics and reporting (Sociality.io, 2026). So, teams don’t want more charts; they want the summary, the why, and the next step without spending half a day exporting stuff. That’s exactly what Sociality.io’s newly launched social media MCP is built for in 2026.
Instead of pulling numbers manually, pasting them into a prompt, and asking AI to make sense of the mess, you can use a setup where the model works much closer to the actual reporting context.
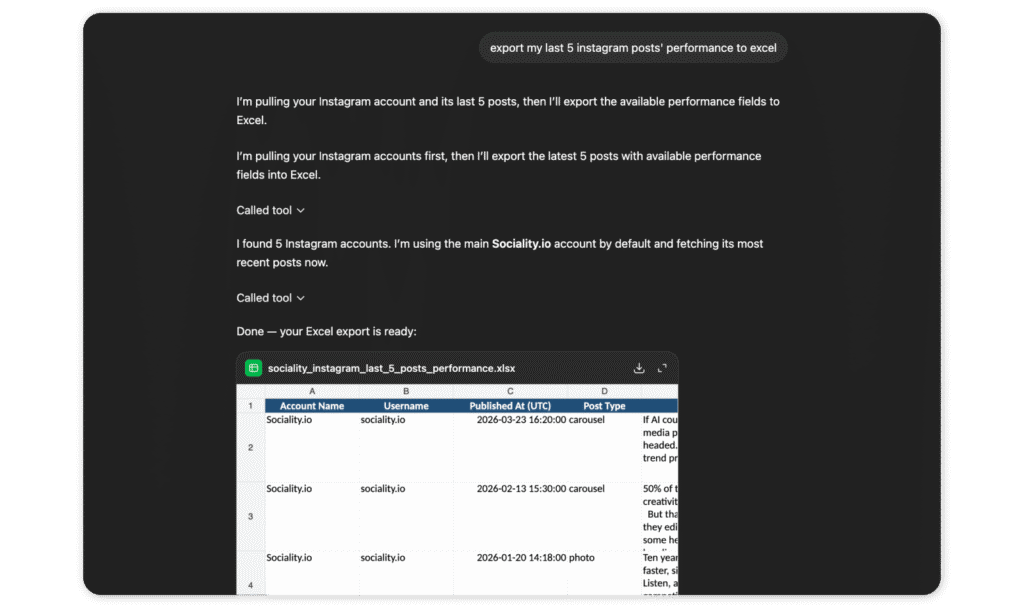
After connecting Sociality.io’s MCP, you can open ChatGPT and ask for the report you need:
What do Instagram analytics actually tell you?
Instagram splits the data into buckets. Each one answers a different question about your growth, your reach, and whether people stick around.
Accounts reached
Think of this as your megaphone. It tells you how many unique people saw your content and who they were (age, location, gender).
- If reach is flat, discovery is flat.
- If top cities shift, your content is breaking into new markets.
Accounts engaged
Accounts engaged is about who actually interacted. Likes, comments, saves, shares. Followers vs. non-followers.
- If non-followers engage, discovery is doing its job.
- If followers engage, loyalty is kicking in. Both matter — but they mean different things.
Total followers
Not just the count, but growth trends, demographics, and when your people are online.
- Spikes = something resonated.
- Drops = you missed the mark (or cut bots, which is fine).
- Active times = when to actually post.
Stories
Stories are brutal honesty. You see taps forward, taps back, exits, and completion rate.
- Too many forward taps = boring.
- High exits = they left you mid-story.
- A clean completion rate = your pacing is working.
Reels
Your reach machine. Views, watch time, replays, saves, shares. (And your audience can download the Reels shared, making them more juicy!)
- If people rewatch, your hook is gold.
- If “saves” spike, you just made evergreen content.
Lives
The spike format. You get concurrent viewers, peaks, replays.
- High peaks but weak replays = people showed up but didn’t see the value later.
- Steady retention = worth repeating.
Ads / boosts
Where money meets metrics. Reach, clicks, conversions.
- High reach but no clicks = wrong creative.
- Clicks but no conversions = wrong landing page.
What’s new? Instagram algo updates (2024–2026 YoY)
| Date | Update | Metric Impact | Action for Marketers |
| Apr 30, 2024 | Instagram updated ranking to prioritize original content and give smaller creators more visibility; reposted content is de-prioritized. | Reach and discovery now depend more on originality; repost-heavy accounts risk lower impressions. | Audit content mix; reduce reposts; double down on original Reels, Stories, and carousels. |
| Dec 18, 2024 | Instagram is forecasted to generate over 50% of Meta’s U.S. ad revenue in 2025 (~$32B). | Indicates growing importance of Instagram within Meta’s business model; ad products are central to growth. | Reallocate budgets toward Instagram ads; optimize reporting to tie campaign metrics to business revenue. |
| Jan 2025 | Instagram’s global ad reach hit 1.74B people (+90.8M, +5.5% YoY). | Expands potential audience size for both organic and paid campaigns. | Scale audience testing; benchmark YoY growth in target regions (e.g., India, U.S., Brazil). |
| Feb 3, 2025 | Meta introduced labels for ads created/edited with generative AI tools. | Transparency expectations: creatives made with AI are visibly tagged in ad placements. | Flag AI-generated creatives in reports; align with stakeholders on disclosure policies. |
| Apr 2025 | Meta expanded teen protections on Instagram: new default restrictions on Teen Accounts. | Teen account interactions and discoverability may be reduced due to safety features. | Adjust expectations for teen-engagement KPIs; shift focus to content types less impacted (Stories, Reels). |
| May–Aug 2025 | Users under 16 require parental consent to livestream or unblur suspected nudity in DMs. | Livestreaming potential among teen audiences restricted; some engagement data may decline. | If targeting youth, pivot live strategies to Stories/Reels; update campaign playbooks accordingly. |
| Jan 2026 | Meta said that on Instagram in the U.S., 75% of recommendations came from original posts in Q4 2025, up after a 10-point increase in original content recommendations. | Originality now has even clearer distribution value in recommendations; repost-heavy workflows risk weaker discovery. | Audit repost-heavy content, prioritize original Reels/carousels, and track whether original formats improve non-follower reach and saves. |
| Apr 2026 | Instagram expanded its 13+ content-rating inspired defaults and Limited Content setting for teens internationally. | Content availability and recommendation exposure for teen users is becoming more controlled by default. | If younger audiences matter to your brand, segment reporting carefully and avoid reading teen-content performance the same way you read adult-audience performance. |
Limitations & challenges of native insights
Instagram’s native analytics do the job but only up to a point. The cracks show fast if you’re managing more than one account or if you need real history.
- 90-day memory → you only get three months of data. If you forget to export, it’s gone.
- No competitor data → you can see yourself, but you’ll never see how you stack up.
- Exports are clunky → screenshots or CSVs at best.
- API restrictions → not everything Meta tracks is visible in Insights.
👉If more than two of these sound familiar, native Insights probably aren’t enough for you.
That’s usually the moment businesses switch to a platform like Sociality.io because they need history, competitor data, and automated reports in one place.
Native vs third-party analytics
Native insights give you the basics, while Sociality.io gives you the full picture. Let’s quickly compare them side by side:
| Feature | Native Insights | Sociality.io |
| Data history | 90 days only | Full history, no wipeouts |
| Competitor tracking | None | Deep competitor analytics side by side |
| Metrics depth | Reach, views, engagement | Extended: follower vs non-follower, saves per reach, story completions, per-format detail |
| Reporting | Manual exports, screenshots | One-click PDF, PPT, Excel reports (automated + scheduled) |
| Collaboration | Tied to single IG login | Multi-user access, enterprise-friendly (no per-user fees) |
| Multi-account | One account at a time | Manage multiple brands, regions, markets in one dashboard |
Top Instagram metrics you must follow in 2026
Not every number on your dashboard deserves your attention. Some Instagram metrics are noise. Some are vanity. A handful will actually tell you if you’re growing or just posting into the void.
Here’s what to keep front and center in 2026 👇
Follower growth
This is your pulse. If growth slows, you might not be showing up in discovery anymore. If it spikes, something worked. You shouldn’t obsess over the total count, but you should track the curve as it shows whether momentum is building or fading.
Reach and views
Reach = New eyeballs
Views = How many times they actually watched (replays included)
If reach rises but views don’t, people saw you but didn’t stick. If views outpace reach, you could have created something worth rewatching.
Engagement rate
Likes won’t take you far in 2026. You should care more about saves, comments, and especially shares. A share in DMs is a discovery booster. If you want to grow, you should write content people can’t help but pass on.
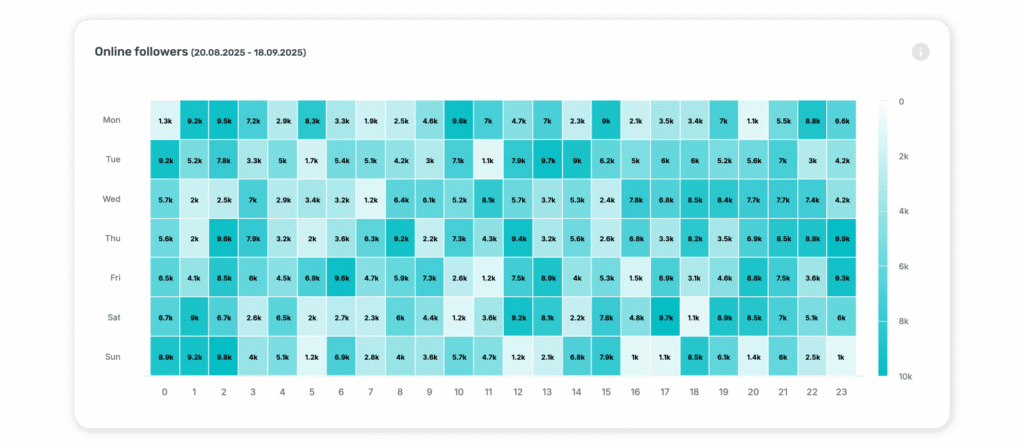
Most active times
The first hour sets the tone. You could post when it fits your schedule, but you should post when your audience is actually online. Even a two-hour shift might change how fast views stack up.
You can see when your audience is online on Sociality.io’s one-screen analytics:
Stories completion rate
Stories tell the truth. Too many forward taps? They’re bored. Exits spiking? You lost them. A steady completion curve means you nailed pacing. Stories could be your testing ground — shorten intros, add stickers, see what keeps people watching.
Reels watch time and saves
Reels are still your discovery engine. Watch time will show you if your hook is strong. Saves will show you if your content has lasting value. Both signals could push you into wider distribution. If one slips, tighten the edit or add a clear “save this” CTA.
Profile actions
Views don’t mean much without movement. Follows, profile visits, and link clicks are the signals that turn attention into actual growth.
Ad performance
If you boost posts, don’t obsess over CPMs. You should focus on clicks and conversions. A creative that racks up views but doesn’t move people is burning budget.
Common Instagram analytics mistakes
Instagram analytics can help you grow fast, but only if you read the numbers the right way. Otherwise, you end up chasing the wrong signal and calling it strategy.
Here are the mistakes I see most often 👇
Obsessing over likes
Likes are easy to spot and easy to celebrate, but they don’t always tell you much. In 2026, saves, shares, retention, and follower vs. non-follower performance usually tell the real story. If you only watch likes, you’ll miss the signals that actually drive discovery and growth.
Treating all formats the same
A Reel, a Story, and a carousel are not built to do the same job. Reels are there to travel. Stories show retention and pacing. Carousels often pull saves. So if you compare them like-for-like, you’ll end up reading the wrong pattern.
Looking at reach without asking who it reached
Big reach looks exciting until you realize it mostly came from people who were never likely to care. That’s why follower vs. non-follower splits, top locations, and audience behavior matter just as much as the total number. Reach alone is only half the picture.
Mistaking visibility for value
A post can get plenty of views and still do nothing for your business. If people don’t save it, share it, click, follow, or come back, attention alone is not enough. Visibility is nice. Value is better.
Checking numbers without context
A drop is not always a problem. A spike is not always a win. You need to read performance through the lens of format, objective, timing, and audience. Otherwise, you’re reacting to numbers without understanding what actually changed.
Using one dashboard for every goal
Awareness, engagement, and conversion do not live on the same KPI set. If your goal changes, your reporting focus should change too. A content piece built for reach should not be judged by the same standards as one built for clicks or sign-ups.
Reporting without action
The point of analytics is not to pile up screenshots for a meeting. It’s to figure out what to keep, what to improve, and what to test next. If the numbers don’t lead to action, they’re just decoration.
Advanced Instagram analytics practices
Once you’ve mastered the basics — reach, engagement, completion rates — the real game begins. Advanced practices are where analytics stop being just a check-in and start becoming a playbook. This is the layer that turns social media from “posting” into strategy.
Hashtag analytics
Hashtags still matter, but only when used with intention. The trick isn’t in stacking thirty random tags; it’s in learning which clusters bring you reach that actually sticks. Track broad, niche, and branded hashtags side by side, and you’ll see which ones deliver not just impressions but saves, profile visits, and follows. That’s when hashtags stop being fluff and start being discovery levers.
Sentiment analysis
Engagement volume is only half the story. Tone is the other half. A post can rack up thousands of comments, but if a large share is negative, that “engagement” is misleading. Sentiment analysis helps you spot shifts early — are people excited, neutral, or critical? When you track this consistently, you can protect brand health and adjust messaging before it spirals.
Influencer campaign measurement
Influencers create noise; your job is to measure signal. Don’t stop at their post likes. Compare your baseline numbers before and after the campaign. Did non-follower reach spike? Did you see more saves or new followers tied to that promo? Did conversions lift with unique codes or links? When you frame influencer ROI in your own numbers, you prove impact instead of guessing.
Cross-platform attribution
People don’t stay on one platform. They bounce from TikTok to Instagram to your site — sometimes in minutes. Without attribution, Instagram either gets too much credit or none at all. UTM parameters solve the basics by showing which Reel, Story, or ad drove the click. Attribution modeling goes deeper: was Instagram the first hello, the middle reminder, or the closer? That’s the clarity you need to plan budgets with confidence.
Audience cohorts & segmentation
Not all followers are equal. Some save everything, some share quietly in DMs, some show up only for Reels. When you segment your audience by behavior, you can see who drives growth and who just inflates numbers. That’s when you stop treating your followers as a blob and start designing content for the clusters that matter.
Content velocity analysis
Every format has its own lifespan. Reels often peak in 24–48 hours, while carousels continue collecting saves weeks later. Stories are instant, and then they vanish. When you study how fast each format rises and fades, you learn how often to post and which formats to pair. Velocity analysis turns “posting more” into “posting smart.”
Paid + organic synergy
Boosting isn’t just about ads. Sometimes, boosting a high-performing Reel gives a halo effect — your next few organic posts ride the wave. Other times, heavy spend can cannibalize organic reach. Tracking paid and organic side by side shows whether you’re amplifying momentum or wasting budget.
Conversion path mapping
The real question: what happens after the view? With the right integrations, you can follow the trail from Instagram to CRM: Story view → profile click → site visit → signup. That’s when Instagram stops being an “engagement channel” and becomes a revenue driver in black and white.
Competitor content gap analysis
Competitors show you two things: what they do, and what they don’t. Sometimes the bigger opportunity is in the gap — a format they never use, a theme they ignore, an audience they overlook. Mapping these blind spots against your own content mix helps you step where others don’t.
Community health metrics
How fast do you respond to comments and DMs? Do people come back to your Stories week after week? Are polls and replies active or drying up? These metrics show the quality of your community, not just its size. And when community health is strong, every campaign performs better.
Turning analytics into strategy
Analytics don’t matter if they just sit in a dashboard. The point is to turn numbers into insights, insights into experiments, and experiments into results. That’s the whole loop.
And the loop only works if you choose KPIs that actually match your objective. If you’re chasing awareness, you’ll look at reach, impressions, and follower growth. If engagement is the target, saves, shares, comments, and completion rates tell the story.
- For traffic, profile visits and link clicks matter more than likes. 🎯
- And for conversion, it’s sign-ups, purchases, and ROI. One size doesn’t fit all — the KPI has to fit the goal, otherwise you’re staring at numbers with no map.
Objective = the trunk
KPI = the branch
Metrics = the leaves
🌳If the leaves are dying, you don’t cut down the trunk; you adjust the branch. Same with content.
Let’s say the objective is “grow awareness in the U.S.” A smart KPI would be “reach in top U.S. cities.” And the metric that proves it would be non-follower reach on Reels.
So, do these next week:
- Pick one KPI tied to your real objective.
- Trace it down to the supporting metric (completion rate, link clicks, saves-per-view — whatever fits).
- Run one small test: shorter intro, snappier CTA, different posting time.
- Check the number again in 7 days.
🎁 Free checklist: Hey! I put together a simple checklist to help you keep track of your Instagram analytics. Download your checklist as a PDF and start tracking your Instagram success!
Benchmarking & competitor analysis
Only if you use benchmarks with the right frame can they be a smart guide.
Numbers on their own don’t mean much; they only come alive when you set them in context. An engagement rate might look high or low at first glance, but without knowing the account size or the type of content, the comparison falls apart.
So, you should start with follower tiers because scale changes the math.
- Smaller accounts often see higher engagement percentages simply because their audiences feel closer and more responsive.
- Larger accounts spread that attention across more people, which naturally lowers the rate. That doesn’t mean they’re failing — it just means the benchmark has to be read differently depending on size.
The next thing you should focus on is format.
For example, a Reel is designed to travel further, a carousel is built to teach and drive saves, and Stories are where you read retention and pacing in real time. So if you put them all in the same bucket, you’ll get misleading results.
The fair way to benchmark is to compare like with like: Reels against Reels, Stories against Stories, carousels against carousels.
Once you factor in both tiers and formats, benchmarks finally become useful. They won’t hand you a ready-made strategy, but they will show whether you’re outperforming peers, holding steady, or slipping behind. And that signal is enough to decide whether you should double down, tweak, or pivot.
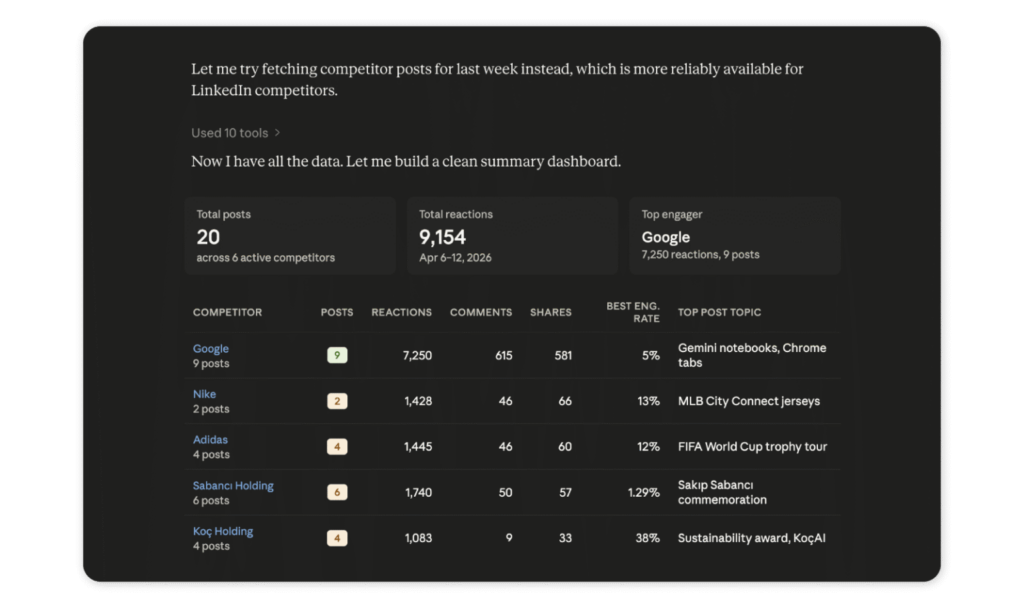
This is also where a tool like Sociality.io makes life easier. Instead of checking accounts one by one and writing numbers down manually, you connect competitor handles once, head into Competitor on the left-hand menu.
Practical roadmaps for different teams
What works for a five-person shop won’t fit an agency juggling twenty brands, and what works for an agency won’t cut it in an enterprise where data has to sync with BI dashboards. So here’s how you can think about it.
1.Small businesses
Keep it simple: three KPIs, one short routine, one monthly report.
Pick KPIs that match your immediate growth stage (reach, follower growth, story completion, for example). Then block out 45 minutes each week to check just those numbers. Once a month, pull them into a report to spot trends.
That’s it. You’ll stay consistent without drowning in dashboards.
2.Agencies
Agencies live in multi-account chaos. You should lean on dashboards that pull everything together, use white-label reports that keep your client-facing decks clean, and focus on ROI storytelling.
A metric like “saves-per-view” means little until you tie it to business outcomes. So build the habit of pulling platform metrics into a narrative that shows not just activity, but impact.
3.Enterprises
At scale, analytics aren’t just for marketers. They feed into BI systems, shape quarterly OKRs, and require governance so that data definitions stay consistent across regions and teams.
Enterprises should integrate Instagram analytics with broader dashboards, set quarterly objectives that tie back to engagement or conversion, and build cross-team cadences. This way, insights don’t die inside the social team; they inform product, brand, and sales decisions too.
Troubleshooting playbook: If X is down, do Y 💪
Sometimes the numbers dip, and the only wrong move is to panic. Most drops have a pattern and a fix you can test.
- Reach down → Reels are your first lever. Test fresher hooks, trending audio, or shorter cuts. Reach is driven by discovery, and discovery depends on content that feels shareable.
- Engagement rate down → Look at format mix. If you’ve leaned too hard on posts that only get likes, balance them with carousels or how-tos that drive saves and comments. Engagement is more than double-taps.
- Story exits up → The pacing is probably slow. Trim intros, cut filler, or add interaction stickers earlier. People leave when they feel stuck.
- Reels views down → Check completion rates. If people drop early, the algorithm stops pushing. A stronger hook in the first three seconds can turn the curve around.
But don’t forget that these will be your very own experiments. So, I suggest trying one at a time, and then you can measure the shift to adjust again.
Reporting & ROI
If you only hand over charts, people switch off. But if you turn those charts into a story, people pay attention. That’s why reporting should always follow one simple shape: Context → Insight → Action → Result.
Weekly reports keep the people doing the work on track. They don’t need to be fancy, they just need to be clear. A quick check on what changed in the last seven days, what worked, what didn’t. Keep it short and sharp — one chart on Reels completion rates week over week will say more than ten pages of screenshots.
Then you roll into monthly reports. Same backbone, but stretched into more of a story. This is where you show not just the numbers moving, but the choices you made because of them. A drop in reach isn’t the story — the story is that non-follower views slowed down, you tested a quicker hook, and reach bounced back two weeks later. That’s context, insight, action, result — plain and simple.
By the time you hit quarterly reporting, the audience changes. Executives don’t care about every detail, they care about the big picture.
- Did Instagram help with awareness?
- Did it bring new leads?
- Did it move revenue?
That’s what they want to see. The best way to give it to them: Three wins, three lessons, three next bets. Clean, easy, and straight to the point.
And you should watch out for this pitfall: If most of your posts are boosted, Instagram’s API only counts the organic likes and comments in third-party tools. The boosted interactions disappear. On a report, that drop makes campaigns look weaker than they really were.
You can fix this simply: Track organic and paid side by side. Organic numbers show how content performs on its own; paid numbers show how well creative drives attention when money is behind it. You need both to tell the real story.
Sociality.io is one of the few tools that solves this automatically. It combines organic and paid interactions into a single view, so your reports reflect the full picture. (No missing likes, no misleading dips, no awkward questions in the boardroom.)
Governance & data hygiene
Analytics are only as good as the systems around them. If the data is messy, the insights will be too. Governance sounds boring, but it’s what keeps reports clean and decisions trustworthy.
You should run regular account audits — not just to check metrics, but to make sure permissions, roles, and settings haven’t gone stale. Who still has access? Which accounts are linked? Where are the gaps?
An export cadence matters just as much. Instagram only holds data for 90 days, so you should lock in a monthly export rhythm. Miss one, and you lose the ability to compare quarter over quarter.
Then come archive rules. Old content, unused campaigns, or outdated benchmarks should be archived in a structured way, not buried in random folders. That way, when someone asks for last year’s results, you don’t spend hours digging.
Permissions are another big piece. Make sure access is role-based, not random. One of the fastest ways to break trust with data is too many people editing, exporting, or renaming files without structure.
And finally: naming conventions. Campaigns, exports, reports — they should all follow a standard pattern. Something like YYYY-MM_CampaignName_Market_Format. It sounds small, but six months later, you’ll thank yourself.
Clean data, clear rules, and predictable exports. That’s governance. It keeps the house in order so strategy can happen on solid ground.
Industry-specific applications
The way you use Instagram analytics depends heavily on the business you’re in.
A SaaS company cares about very different signals than a local coffee shop. So here’s how analytics can play out across industries, with quick examples to show what it looks like in practice.
E-commerce
For online stores, Instagram is often the front door to sales. Metrics like product-tag clicks, story swipe-ups, and follower vs. non-follower reach tell you if your content is driving shoppers into the funnel.
Example: An e-commerce brand tracks product-tagged posts and sees that carousel posts with “how-to style” demos drive 40% more add-to-carts than lifestyle photos. That’s a content strategy signal.
SaaS
For software, the platform is more about education and trust than direct checkout. Saves, shares, and carousel completions matter more than likes.
Example: A SaaS company runs a series of “3-slide explainer” carousels. Analytics show saves doubled compared to single-image posts, and profile clicks rose by 25%. That becomes proof that teaching is also selling.
Media / publishing
Here, retention is king. Story exits, tap-forwards, and video completion rates tell you if your content is keeping people hooked.
Example: A digital publisher notices that Reels under 20 seconds keep 70% completion, while anything longer drops below 40%. The decision? Shorten video edits across channels, because the data shows people don’t stick around.
Local businesses
For a café, a gym, or a boutique, the priority is foot traffic and community loyalty. Location-based reach, profile visits, and direct message volume are gold.
Example: A local restaurant runs weekly Reels showcasing new menu items. Analytics reveal that posts tagged with the city name not only reach more non-followers, but also double profile visits on posting days. That’s growth you can measure at the register.
Wrapping up
Instagram analytics in 2026 revolve around views, shares, and original content. Weekly fixes, monthly reviews, and quarterly strategies guide reporting cadence. Meta apps now reach 3.27B daily users (+7% YoY), and Instagram alone drives 1.74B global ad reach. Reels dominate with 70%+ of views, while shares outperform likes for discovery. Native Insights only retain 90 days of data, requiring regular exports. Marketers should track signals like follower vs. non-follower reach, sends-per-reach, and story completion. For deeper insights and automated reporting, third-party tools like Sociality.io fill the gaps beyond Instagram’s native dashboards.
FAQ about Instagram analytics
Before I wave goodbye 👋, I’d love to keep the conversation going on LinkedIn! If you have any thoughts, comments, or suggestions, please share—I’d really love to hear them!