



Instagram Reels analytics decoded: Prepare better reports & reels in 2026
Summarize this article via
Instagram Reels analytics rules have changed. Since April 2025, Reels analytics metrics like Plays and Impressions are out; Views are the new baseline. This affects everything from engagement rate to reporting.
It changes how you track retention.
It changes how you benchmark wins.
And if you’re reporting to clients or bosses? It changes how you prove you’re doing your job well.
That’s where this guide comes in.
You’ll learn exactly what changed (and what didn’t), which metrics matter most, how to audit Reels like a pro, and how to actually report results that make people care.
- What’s the shift in Instagram Reel insights and metrics in 2026?
- 10 Instagram reels metrics explained
- Competitor Reels analysis, right inside your AI chat
- How to see Instagram Reels analytics
- How to check Trial Reel insights
- Create Viral Reels with insights (no more guessing)
- What to look for in an Instagram Reels analytics tool
- How to report Reels to stakeholders
- ⭐️ Mini glossary
- Wrap-up
TL;DR for busy fellows
- Instagram Reels remain critically important in 2026: 48.6% of marketers named short-form video their biggest-ROI format in 2026. Long-form video came second, at 28.6%. And 1 in 5 marketers are doubling down on Instagram in 2026.
- New rules for reporting: Instagram analytics killed Plays and Impressions. Now, everything is measured in Views—and on a Reel that means the moment playback starts, replays included.
- Engagement rate formulas have changed. Recalculate yours if you’re still using Plays.
- Watch time is your new best friend. Instagram gives you total and average watch time; completion rate you work out yourself. Retention drives reach.
- Shares > Likes: Mosseri confirmed that DMs and shares are stronger discovery signals.
- Timing still matters: 12–3 PM or 3–6 PM (U.S.) is a reasonable place to start if you have nothing better. It is a starting point, not a benchmark—run your own test.
- Reporting smarter > reporting more: Use metrics like view-to-follow and completion-to-length to tell a clearer story. + Use AI for Instagram Reels reporting as 59.5% does.
- AI chat is now part of Reels analysis: With Sociality MCP, you can ask about your Reels and competitors’ Reels directly in your AI chat — from top organic posts to winning formats and what to create next.
- Sociality.io gives you a fast and clean Instagram Reels analysis report: everything in one place.
What’s the shift in Instagram Reel insights and metrics in 2026?
Instagram metrics just got simpler—and that’s good news for marketers who’ve spent too long comparing apples to oranges across platforms.
As of April 21, 2025, Instagram waved goodbye to Impressions and Plays, shifting instead to a unified metric: Views. Previously, a Reel needed at least one second of playback to count as a “Play,” and “Impressions” measured how many times the content appeared on a user’s screen.
But “Views” doesn’t mean the same thing on every format. On a Reel it’s the number of times your reel starts to play or replay—playback has to start, and a rewatch adds another one. On a photo or a carousel there’s nothing to play, so it counts when the content is displayed. Same word, different trigger. And the metric for “was it on screen at all, played or not” is Viewers. Different number entirely. Either way, Meta’s 2025 unified measurement update aligns Instagram’s reporting with platforms like TikTok, creating clearer, more consistent metrics across social media.

Don’t worry, historical Impressions data won’t disappear—posts made before July 1, 2024 will retain their original metrics, so your year-over-year comparisons remain intact.
That said, in third-party analytics tools, older Impressions may not be retrievable anymore via newer Meta API versions—many platforms now map or replace Impressions with Views after Meta’s deprecation timelines. (Social Media Today, 2026)
In fact, Meta’s broader ‘Views-first’ direction extends beyond Instagram UI: the Page Insights API removed Impressions as of November 15, 2025, pushing ecosystems (dashboards, exports, connectors) to standardize on Views.
Instagram Reels Insights—the analytics dashboard inside professional accounts—now clearly surfaces how each Reel performs and how audiences interact. Beyond Views, Instagram provides metrics for Watch time (total time viewed, including replays) and Average watch time (typical viewing duration per viewer), helping marketers understand retention and pacing, not just raw view counts.
Such changes don’t slow down the success of short-form videos. Reels continues to dominate ROI and growth. Marketers consistently rank Instagram among the top platforms for driving traffic, engagement, audience expansion, and community building.
📣Real-world marketers and academics support this claim:
Solo strategist Mansi Joshi, tracking Reel trends through 2025, reports Reels still pulling well clear of static photo posts on engagement.
Meanwhile, Shoo Wei Khoon, a marketer with 11+ years of experience, observes, “Carousel posts are quietly becoming the engagement champions, while Reels still dominate in reach.”
Academically, research shows short-video recommender systems heavily rely on watch-time feedback. However, naive reliance on this metric alone can bias models—highlighting the importance of retention-focused metrics like Watch time and Completion rate alongside Views.
10 Instagram reels metrics explained
Let’s spend less time counting—and more time understanding. These are the Instagram Reels performance metrics that actually matter in 2026:
1.Views (2026 primary Instagram Reels metric)
A “View” is counted every time a Reel starts to play or replay—yes, even if someone rewatches it five times. That’s Instagram’s own wording. So, this one now rules them all.
Instagram standardized on views across formats; Adam Mosseri, the head of Instagram, clarified, “Views are different from reach,” and urged tracking sends per reach.
So, views are the new denominator for engagement rate and cross-format benchmarking.
Before the April 2025 update, engagement rate was typically calculated like this:
(Likes + Comments + Shares + Saves) ÷ Impressions or Plays
Now it is:
Engagements ÷ Views
2.Reach
Reach is the count of unique accounts that saw your Reel at least once. So, this is Instagram’s official “distinct viewers” metric in Insights, shown as Accounts reached in the app.
Use it beside views to read behavior:
- If views ≫ reach, people are rewatching.
- If reach climbs period-over-period, the distribution is expanding.
3.Watch time (total) & average watch time
Total sums all viewing time, everything, all, the whole caboodle.
And the average watch time metric shows the typical time watched per viewer, which is what most people mean by average Reel watch time.
Instagram optimizes feeds by predicting how engaging a post will be (e.g., likelihood to keep watching), so retention signals drive distribution.
Here’s why they matter a lot: It’s the strongest read on hook strength and pacing beyond raw counts.
4.Completion rate
I’d sum this one up as the percentage of views that reach the end. In short-video systems, completion is a significant engagement proxy. Instagram just doesn’t hand you the number. You divide average watch time by Reel length and you’re close enough. That’s exactly what any dashboard showing you a completion rate is doing. One catch: watch time counts replays, so a short looping Reel can sail past 100%.
What’s good depends on length, so benchmark like-for-like. These are directional—practitioner numbers, not Instagram’s—so swap in your own medians once you’ve got 30 Reels to average:
- 7–15s: ~50–70%
- 30–45s: ~30–40%
- 60–90s: ~25–35%
If you’re under 20% most of the time, it’s usually a hook/pacing issue — not your topic.
5.Engagements (likes, comments, shares, saves)
The head of Instagram, Adam Mosseri, has repeatedly highlighted shares in an interview cited by Business Insider.
Mosseri states that shares are “one of the most important metrics to watch” and a core reach driver, especially through DMs.
Share rate = Shares ÷ Reach
- <0.5% weak
- 0.5–1% healthy
- 1–2% strong
- 2%+ high discovery potential
Same deal—directional, not Instagram’s. Share rate swings by niche and account size, so build your own baseline before you call a number weak. The logic holds everywhere though: likes are approval, shares are recommendation, and recommendation expands your reach.
6.Follows & profile actions
Down-funnel signals, profile visits, and follows convert attention into community and pipeline. To me they’re the clearest client-reporting bridge from visibility to business outcomes.
So, you should track view-to-follow and view-to-profile-visit ratios.
This is the conversion metric stakeholders actually care about:
View-to-follow rate = New followers ÷ Views
- <0.3% low conversion
- 0.3–0.8% typical
- 0.8–1.5% strong
- 1.5%+ high-intent content
Again, directional—nobody at Instagram published these. Measure your own median across 30 Reels and use that as your line. If a Reel clears it, it’s not just getting views — it’s building audience.
7.Sends (DM shares) & sends per reach
You already track shares. But if you can, separate DMs (“sends”) from the rest.
Because a send is not a like. It’s a “this is for you” moment.
So, add this to your ratio list:
Sends per reach = Sends ÷ Reach
This one is extra useful when you’re trying to explain why a Reel got reach (and why another didn’t), without sounding like you’re just chasing vanity stats.
8.Like rate (normalized)
Likes are still fine. They’re just… messy.
A Reel can get a ton of likes just because it got pushed hard. So I prefer the normalized version:
Like rate = Likes ÷ Reach (or ÷ Views, if you’re using views as the denominator everywhere)
If views are high but like rate is dropping, it usually means: the hook worked, people stayed for a second, but it didn’t land emotionally.
9.Follower vs non-follower reach
This one tells you whether you’re growing or just entertaining your existing crowd.
If non-follower reach is rising → Instagram is showing you to new people (nice)
If it’s mostly followers → you’re doing community content (also nice), but discovery is limited
So yes, still a good metric. Just think of it as “discovery mix.”
10.Where views came from/distribution source
When a Reel spikes, don’t just celebrate. Check where it came from.
Was it:
- Reels tab
- Explore
- Feed
- Profile
Because “12k views” from Feed vs “12k views” from Reels tab are not the same story. One is follower-based, one is algorithm-based.
That’s the metric set. Keeping it current is the harder part—especially once you’re opening Reels one at a time to fill in a monthly report.
That’s the point where I’d let a tool take over. Sociality.io puts them in one view: your full list of Reels with reach, views, watch time, saves and profile visits side by side. Charts leave as PDF, PPT or Excel without anyone rebuilding them by hand.
It’s free to try if you want to see your own numbers in it.
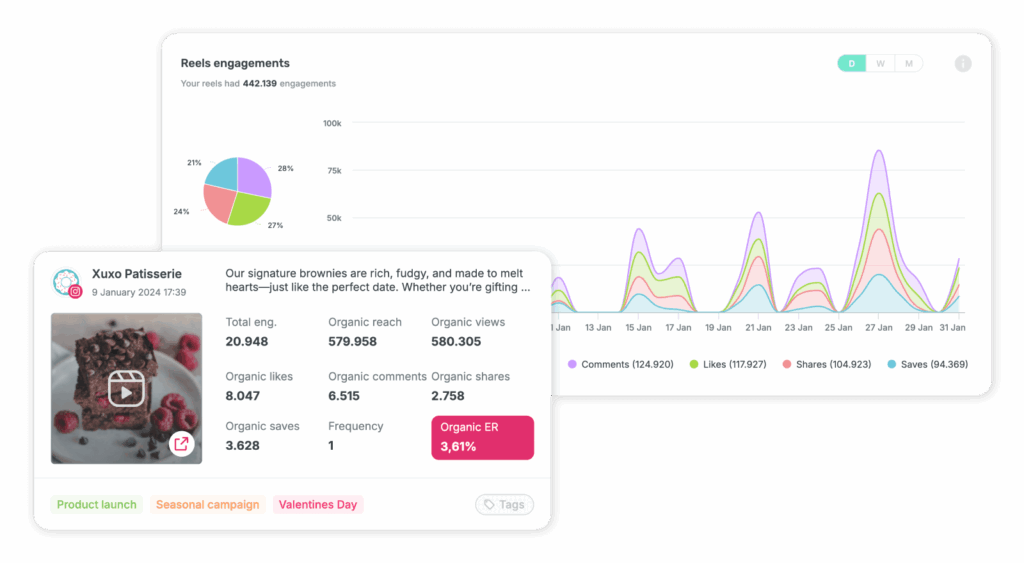
Now, the most practical way to see your Instagram Reels analytics and understand what works for you and your competitors is to connect a social media MCP.
With Sociality MCP, you can basically chat with your Instagram Reels analytics data.
Let’s make it practical.
Competitor Reels analysis, right inside your AI chat
Say you’re checking a competitor’s Reels performance for April 2026. They posted 40 Reels in total, which means they were publishing around 1.3 Reels per day. At first glance, their biggest Reel looks insane: 47.3M views.
But then you look closer.
That one was paid.
Useful to know? Of course. But not the Reel you should copy first.
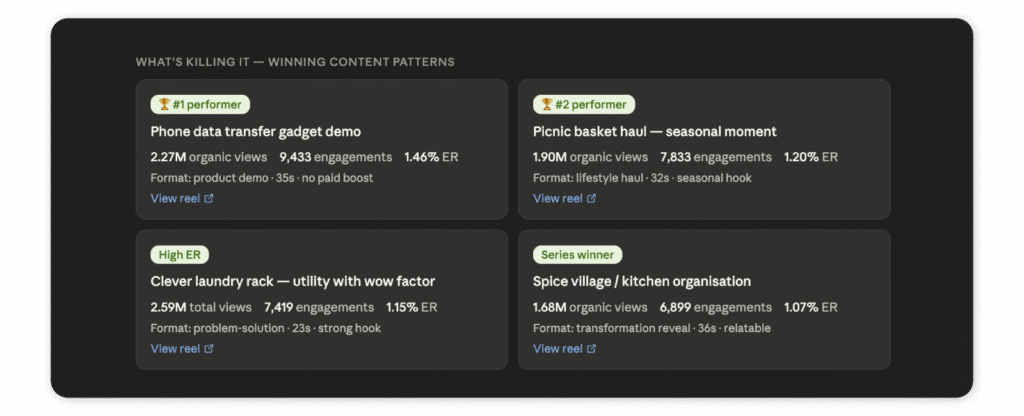
The more interesting part is what worked organically. Their best organic Reel was a phone transfer gadget demo with 2.27M views, 9,433 engagements, and a 1.46% engagement rate. No paid boost. Just a clear product demo, a simple “wait, I need this” hook, and a 35-second format that gave the product enough time to shine.
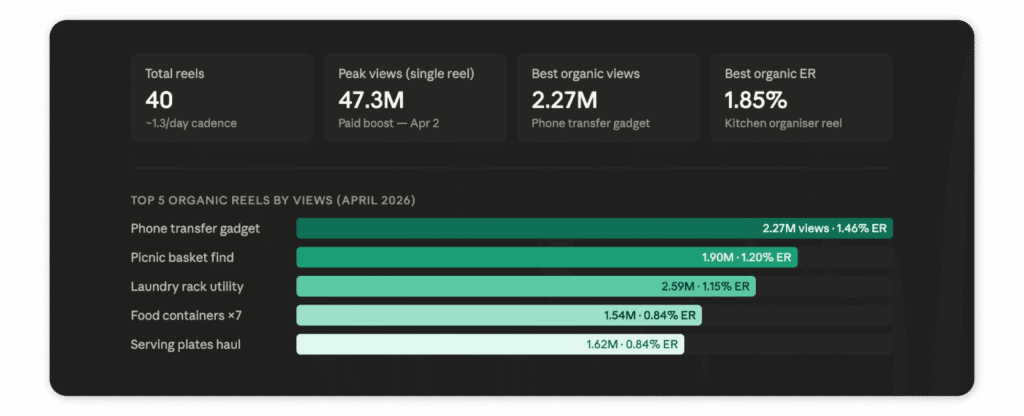
And when you look at their other top organic Reels, the pattern becomes pretty obvious:
- Phone transfer gadget demo — 2.27M views, 1.46% ER
- Picnic basket find — 1.90M views, 1.20% ER
- Laundry rack utility Reel — 2.59M total views, 1.15% ER
- Food containers ×7 — 1.54M views, 0.84% ER
- Serving plates haul — 1.62M views, 0.84% ER
So, what’s working for them?
Product demos, gadget reveals, utility finds, seasonal hauls, and kitchen organisation. Basically, content where the viewer gets the value in the first few seconds.
Then you compare that with the weaker Reels.
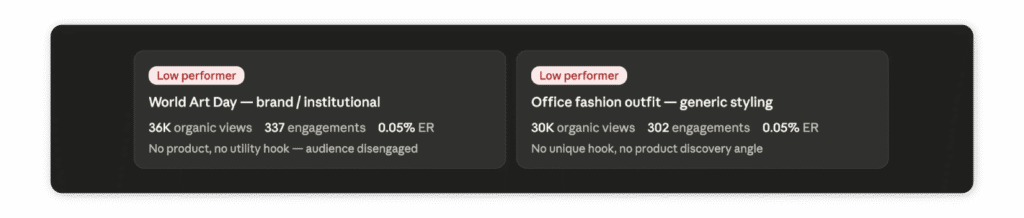
Their World Art Day Reel had 36K organic views and a 0.05% ER. Their office fashion Reel had around 30K views and the same 0.05% ER. Both were more brand-led, less useful, and didn’t really have a strong product discovery angle.
And this is exactly why competitor Reels analysis matters.
You’re seeing the pattern behind it: the ideal length, the early hook, the product payoff, the seasonal timing, the series ideas that pull comments, and even the promoted posts that may not have worked organically.
So your next move becomes much clearer. Instead of copying the Reel with the biggest number, you can find the organic winner, understand why it worked, and build your own version with a stronger angle.
That’s the kind of analysis you can do much faster with Sociality MCP.
Instead of exporting data, checking Reels one by one, and trying to connect everything manually, you can ask your AI chat questions like:
“Which competitor Reels performed best organically?”
“What formats are driving the highest engagement?”
“Which Reels look boosted?”
“What should we create next based on these patterns?”
And suddenly, Instagram Reels analytics stops being a pile of numbers and starts becoming an actual content strategy.
How to see Instagram Reels analytics
First things first—if you’re not using a Business or Creator account, you won’t see any insights. So double-check that.
Once that’s set, you have four ways to access Instagram Reels analytics:
1. Profile-level overview
- Go to your profile.
- Tap the Professional Dashboard.
- Select Content You Shared → then choose Reels.
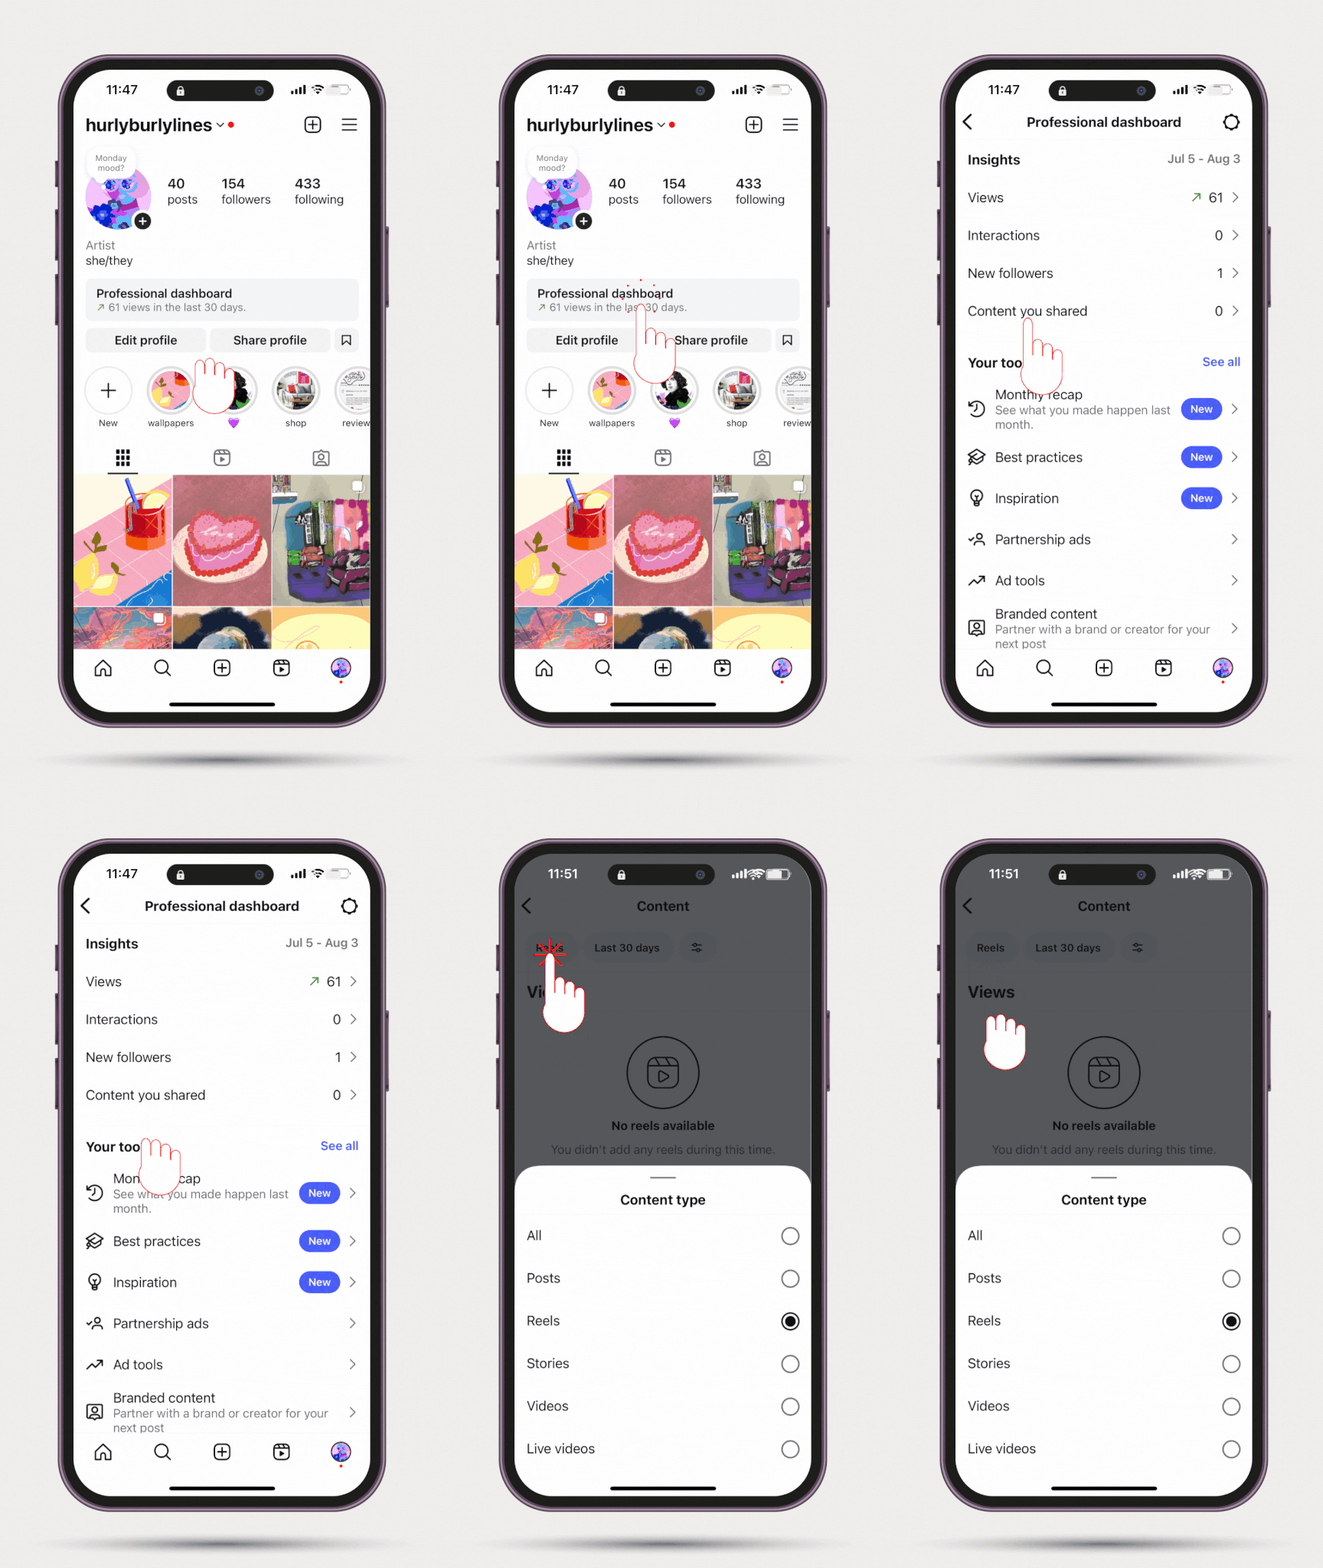
This gives you a clean, account-wide snapshot of Reels performance: views, reach, engagement, saves, profile visits, follows—filtered by time period.
2. Insights via a single Reel
- Open any Reel from your grid or Reels tab.
- Tap the three dots (•••) in the bottom-right.
- Choose View Insights.
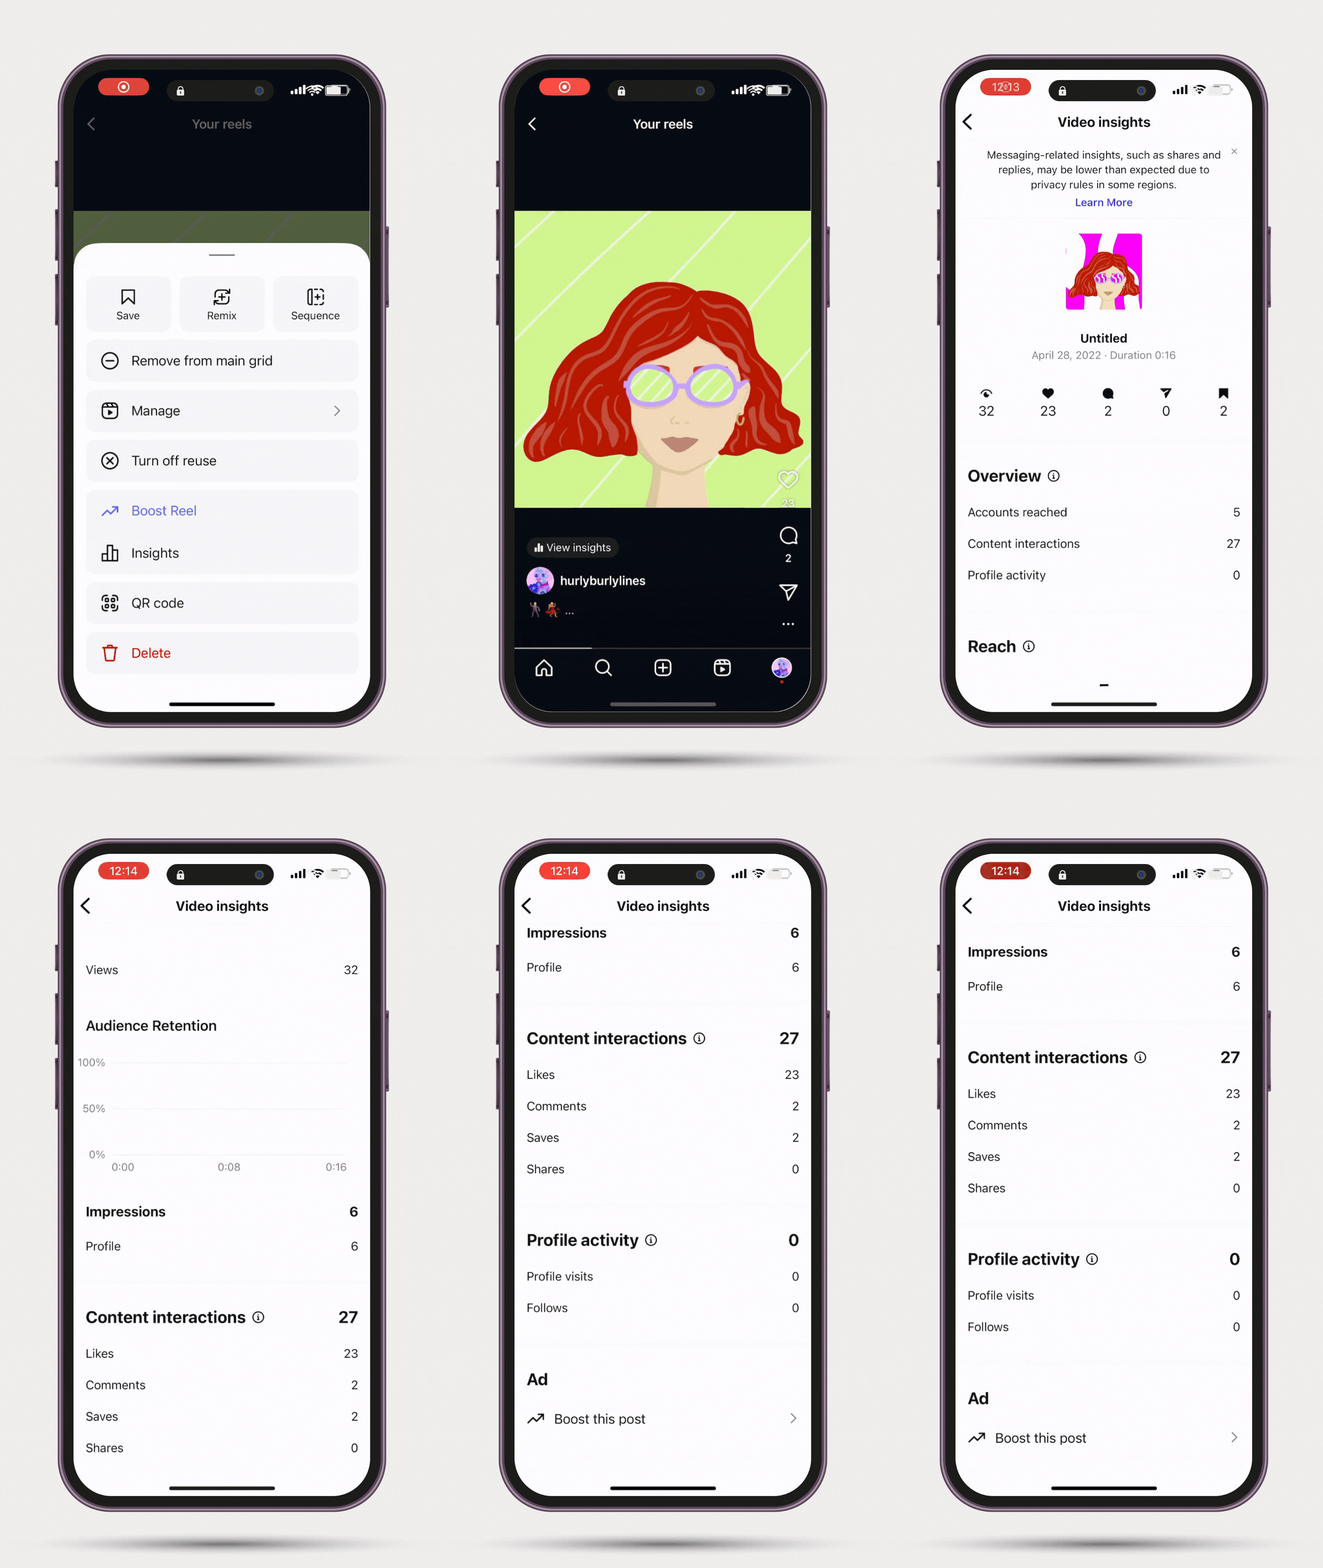
You’ll see views, watch time, average watch time, viewers, follows and the interaction counts—saves, shares, comments. No completion rate here, so that one you work out yourself. Useful if you’re analyzing hooks or creative changes.
📝 One thing to keep in mind:
Reels older than two years may not appear in Insights anymore, depending on your region and account type. So if you’re planning a long-term performance analysis, export or log your data early.
3. High-level reporting
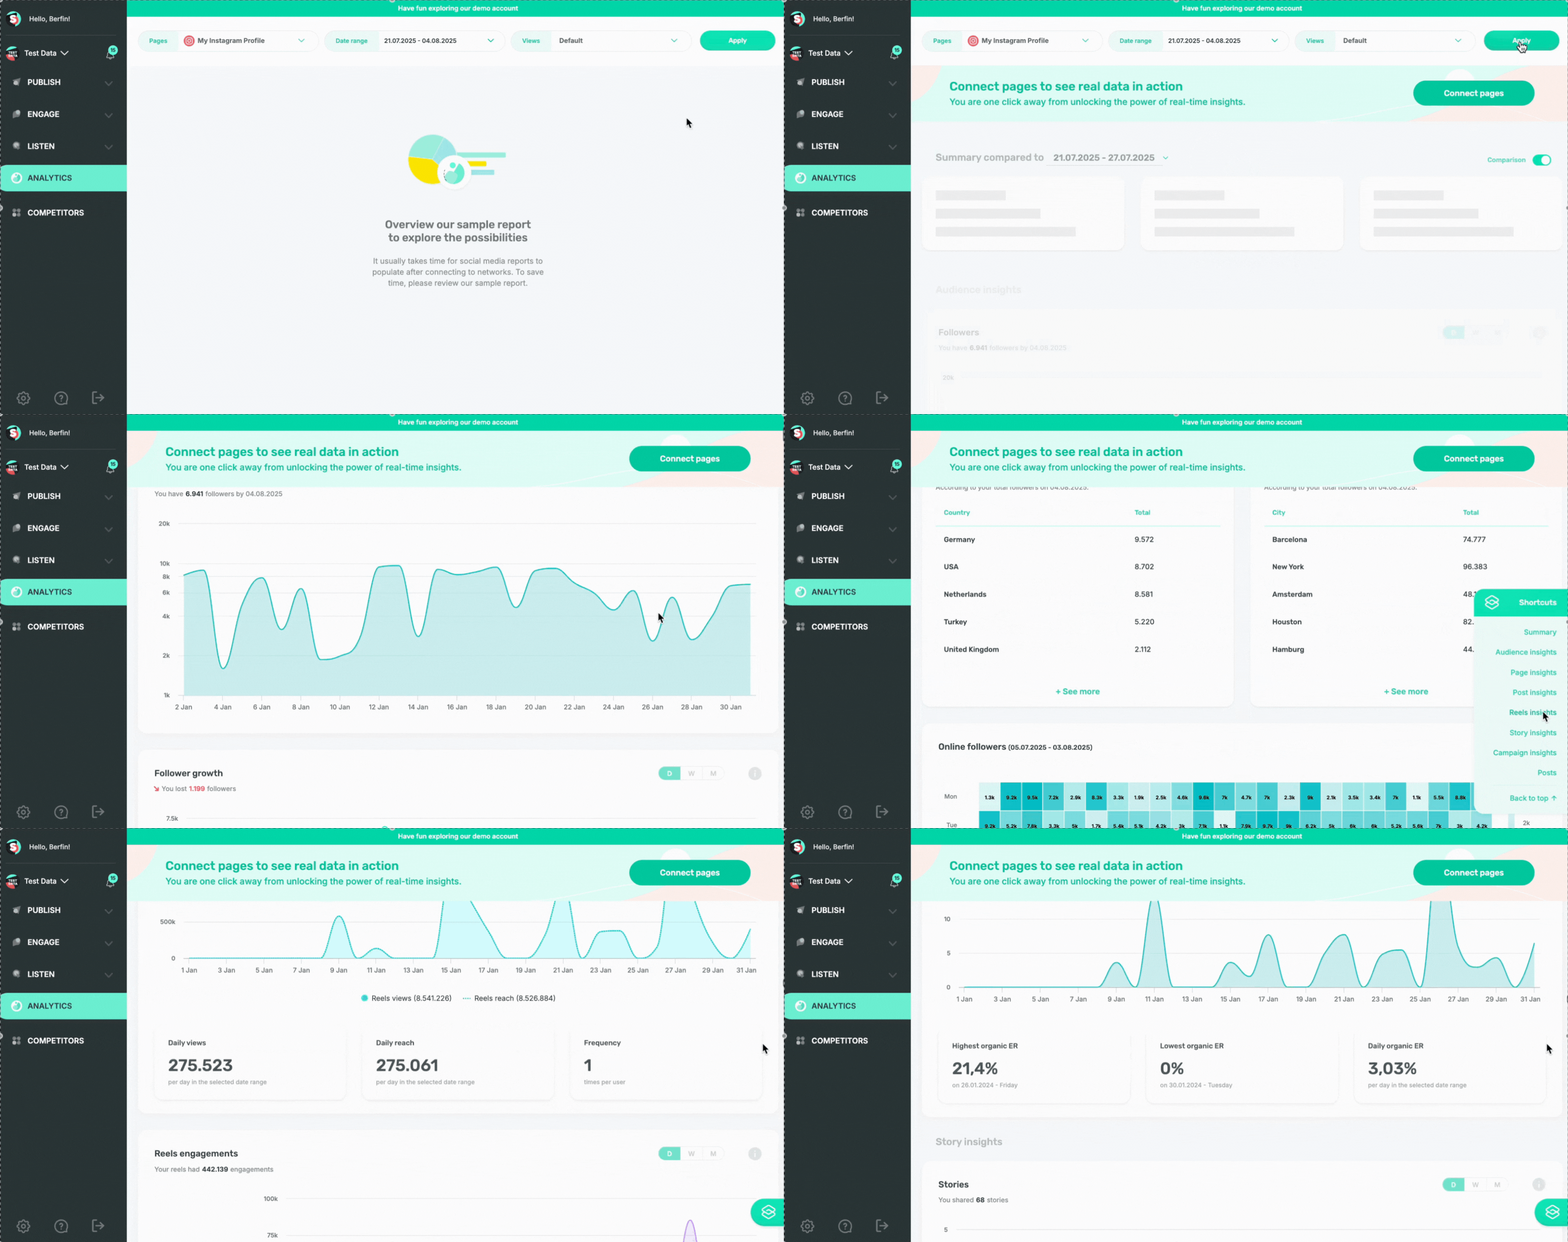
This one’s for marketers who don’t have time to tap through every Reel.
Just head over to Sociality.io—your new favorite shortcut to see how every Reel is doing in one place.
- Under Analytics, select the date range you want.
- Click the shortcut button for your Instagram Reels analysis.
That’s it. You’ll instantly get:
- A full list of your Reels
- Key stats like reach, views, watch time, saves, profile visits, and more
- Ready-to-share charts and visuals
- Exportable reports (PDF, PPT, Excel—you choose)
4. Ask ChatGPT, Claude, or Gemini through Sociality MCP
There’s also a newer way to look at your Reels analytics: connect Sociality MCP and ask your AI chat directly.
Once your AI chatbot is connected to your Sociality.io dashboard through MCP (it takes just a minute, yes, a minute, I’ve connected many times), you can ask questions like: Other servers cover different jobs, and we listed the social media MCP servers worth connecting.
“Analyze this competitor’s April 2026 Reels performance. Find their best organic posts, weakest posts, ideal Reel length, and content patterns we can use.”
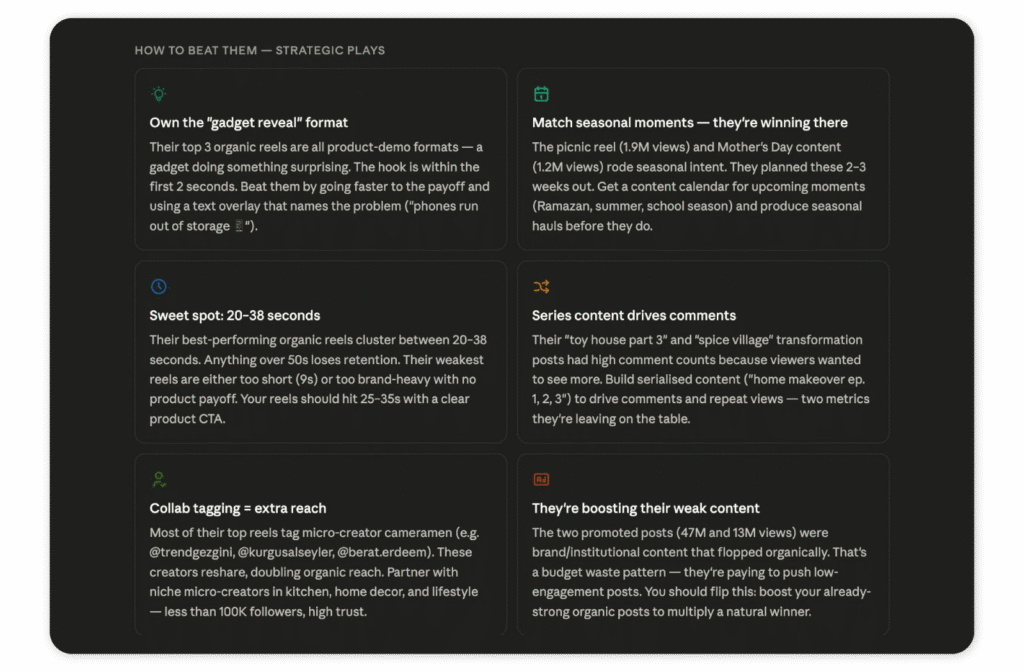
So instead of opening every Reel and checking metrics one by one, you can start with the question. Sociality MCP brings the data into the chat, and your AI chatbot helps you understand what’s working, what competitors are doing better, and what to create next.
How to check Trial Reel insights
Trial Reels give you Reels analytics before your followers see anything. Publish with Trial switched on and Instagram shows the Reel to non-followers only, so your own audience never gets it in feed unless you decide to share it later.
Here’s how to see your trial Reels. Open your profile, go to the Reels section where trials sit apart from your public grid, select the trial Reel, and tap View Insights.
Give it about 24 hours first. Instagram needs that long to find non-followers who might actually care, and anything you read before then is noise. Once the data lands you’ll see views, likes, comments and shares for that trial, plus a comparison against trials you’ve run before. The comparison is the part worth looking at, because a cold audience is a far harsher test than your followers.
Knowing whether a trial Reel is doing well comes down to rates, not totals. A trial that pulled 8,000 views with a 12% completion rate lost people fast. One that pulled 900 views and held 60% of them found a real hook, and that’s the one that earns the share-to-everyone button.
Timing works differently here too. If you switch on automatic sharing, Instagram decides whether to push the Reel to your followers based on the views it collects in the first 72 hours. So the best time to upload a trial Reel is whenever that window gets a clean run at your audience rather than a dead holiday weekend.
Create Viral Reels with insights (no more guessing)
Reels analytics is definitely an excellent addition to your Instagram audit. But how do you leverage these insights to make better Reels? Now that you know what every Reel metric stands for and how to access analytics, let’s put all these findings to work.
We’re going full audit mode. Hook structure, pacing, captions, timing, edits, and audio. All of it. Because creating a Reel that pops is testing what works and repeating it with purpose.
1.Start with the first 3 seconds
If your Reel doesn’t do something interesting in the first 2–3 seconds, people scroll. That’s it. You’ve lost them.
High-performing Reels usually open with fast motion, a question, a cut, or something that builds tension. Study yours. The top ones probably don’t start slow.
👉You should check your average watch time and completion rate. If viewers drop before the 3-second mark, your hook isn’t working.
2.Tighten the pacing
Slow intros kill retention. Look at your watch time curve: if there’s a dip after the hook, your pacing is too slow.
Cut filler. Use more edits. Add motion.
Voilà! ✅
Shorter, sharper captions help guide viewers without losing attention.
3.Test Reel length
Your analytics will act as a Reel analyzer and tell you which duration works. Post Reels of different lengths to test what resonates most with your audience—quick, TikTok-style clips or longer videos. Ideal Instagram Reel length may vary, but our guidelines can help you find the sweet spot faster.
You can compare Reels by completion rate and avg. watch time across different lengths:
- 7–15 sec → quick ideas or visual reactions
- 30–45 sec → storytelling, how-tos
- 60–90 sec → deeper or CTA-driven content
4.When you post matters more than it looks
You should be careful about when to post on Instagram. Posting during “active hours” doesn’t guarantee reach. Run timing tests to identify the best time to post Instagram reels in 2026. Post similar Reels on different days and hours, then compare view velocity (how fast views come in) and completion rate. Even a 2-hour difference can shift performance.
5.Audio drives replays
Check which Reels have higher rewatch rates. Odds are they use sound that fits the pacing. You can sync visuals to beats—people love it.
You can also consider sticking with trending royalty-free audio that aligns with your tone. When users rewatch—even accidentally—Instagram takes that as a positive signal.
➡ Metric to monitor: Views ÷ Reach (aka replay ratio), Avg. watch time boost with audio vs. no-audio posts
6.Don’t skip the CTA
Check how many Reels lead to profile visits or follows. If those are low, your Reels might end too passively. “Save this,” “Follow for more,” or “Tap the link in bio” are small prompts with big impact.
People tend to do such actions when they’re asked. 🤝
7.Study your winner reels (and losers)
Always analyze your Reels after grouping them by performance.
- What do the top 10 have in common?
- Same length?
- Same style of caption?
- Same audio category?
Do the same with your bottom 10. This can be your blueprint.
8.Format matters for Instagram Reel success
Instagram has specs for a reason: off-size Reels or glitchy filters can limit reach. Poor video quality often shows up in Reels with strong hooks but low completion or share rates. So, always be sure that you format your content cleanly.
- 9:16 ratio
- 1080×1920 resolution
- Safe text margins
- Captions enabled
What to look for in an Instagram Reels analytics tool
Native Insights runs out of road quickly. It won’t hold more than 2 years of history, it won’t put your Reels next to a competitor’s, and it won’t build the report for you. That’s the point where an Instagram Reels analytics tool starts paying for itself.
Not every tool that calls itself a Reel analyzer does the same job, so it’s worth checking five things before you commit.
- Retention data, not just counts. If the Instagram Reels analytics dashboard shows views and likes but no watch time, and no completion figure derived from it, you can’t diagnose a hook.
- Rates as first-class metrics. View-to-follow, share rate, sends per reach. A tool that makes you export to a spreadsheet to divide two numbers isn’t saving you anything.
- Competitor Reels in the same view. Your own numbers mean very little without a benchmark.
- History beyond Instagram’s window. Reels older than 2 years drop out of native Insights, so your tool needs to have logged them already.
- Export a client will actually read. PDF, PPT and Excel, not a screenshot of a chart.
Run a shortlist against those five and most Instagram Reels analytics tools sort themselves out fast.
Sociality.io was built against that list. Watch time and completion rate sit next to the ratio metrics in the same Reels view, competitor benchmarks layer on top of your own numbers, and the report leaves as a PDF, PPT or Excel file without anyone rebuilding it by hand.
There’s a second way in if you’d rather skip the dashboard. Connect the Sociality MCP server and your Reels data lands inside ChatGPT, Claude or Gemini, so you can ask which Reels held attention longest, or what a competitor’s strongest organic format was, and read the answer in the chat instead of a spreadsheet.
Prefer comparing named tools to criteria? I ran those same five checks across a couple of dozen platforms in my Hootsuite alternatives and Sprout Social alternatives posts. Pricing, analytics depth and support, lined up next to each other.
How to report Reels to stakeholders
Instagram Reels stats are useless if they don’t speak your client’s language. Your job is to translate metrics into outcomes—brand visibility, audience growth, conversion paths.
And no, “we got 12k Instagram reels views” isn’t enough.
So, a proper Reels report in 2026 should combine:
• Instagram Reel metrics
• Instagram Reel insights checker validation (from native data)
• Period-over-period Instagram Reel analysis
If you’re using a tool, your Instagram Reel dashboard should let you export structured Reel stats, not just vanity charts.
You can also hand the grunt work to AI in social media analytics. An AI-powered tool like Sociality.io can act as your Reels analyzer. In fact, 23.7% of marketers say AI tools already help them speed up reporting and insights, making performance analysis faster and more actionable.
And if you want to make this even faster, connect Sociality MCP and talk to your AI chatbot directly.
Through the MCP connection, your chatbot can pull data from your Sociality.io dashboard, so you can ask more layered reporting questions like:
“Compare our Reels performance with our top three competitors for the last 30 days. Show which formats drove the highest organic engagement, which posts look boosted, and what we should copy, avoid, or test next.”
“Find the Reels that brought strong reach but weak profile actions. What does that say about our hook, CTA, or content angle?”
“Analyze our best-performing Reels and competitor winners together. What patterns show up in length, format, topic, posting time, and engagement rate?”
“Turn this month’s Reels data into three client-report takeaways: what worked, what underperformed, and what we’ll change next month.”
So your report doesn’t just list Reels metrics. It connects the numbers to a clearer story: what happened, why it matters, and what to do next.
1. Start with the metrics that prove a point
I’m talking Views, Reach, Watch Time, Completion Rate, Follows, and Profile Actions. These are your go-to numbers—whether you’re reporting brand lift, community growth, or ROI-friendly engagement.
2. Make ratios your secret weapon
Raw numbers can only get you so far.
“This Reel converted 3.4% of viewers into followers—double our average” gets attention.
You can use Sociality.io to track:
- View‑to‑follow rate
- Saves-per-view
- View-to-profile visits
- Watch time per Reel length
3. Spotlight your outliers
There’s always one Reel that does something unexpected. Maybe it spiked followers. Maybe it crushed the completion rate. Pull it out. Dissect it.
Inside our AI-powered social media analytics tool, you can sort Reels by reach, engagement, or saves to find your MVPs.
Then tell the why behind the win:
- Was it the hook?
- The music?
- The post time?
That’s the stuff reports are made of.
4. Add visuals they can’t scroll past
No one wants to read another spreadsheet. But a sharp visual? That they’ll remember.
Sociality.io, one of the best social media analytics tools, gives you exportable graphs and breakdowns—Reel-by-Reel or full account view. Watch time over time. Follows per post. Engagement trendlines.
You’ll look like you did way more work than you actually had to (thank you, automation 💜).
5. Automate like a pro
Your reporting shouldn’t eat your Mondays. Set up scheduled reports in our tool—weekly, monthly, quarterly, doesn’t matter. Pick the format: PDF exports, PPT, Excel, whichever you need. Done.
Clients love it, and your team will love you for it. And it keeps everyone aligned—without extra effort from you.
6. Always end with what’s next
Every report should tell a story. But it should also say, Here’s what we’ll do with this.
You can close with three punchy takeaways:
- “Reels under 30s had the highest completion rate.”
- “Trending audio drove 2x profile visits.”
- “Best time to post this month? 6–8 PM.”
With our tool, you don’t have to dig deep for these—you just know them. Bonus: you can layer in competitor benchmarks to show exactly where you’re ahead (or need to push harder).
So if you’re tired of vague reports and vanity stats, here’s your fix: detailed, strategic, and beautifully packaged—ready for the CMO or the client. All backed by Sociality.io.
Want help crafting a reporting deck that hits hard? Let’s build it next.
FAQs about Instagram Reels metrics
⭐️ Mini glossary
| Term | Definition |
|---|---|
| Views | The number of times a Reel starts to play or replay. Replays count, so views run higher than the number of people who saw it. |
| Viewers | The unique accounts that had a Reel on screen at least once, whether or not it played. |
| Completion Rate | The percentage of views that reach the end of a Reel. Not a native Instagram metric, so it is derived from average watch time and Reel length. |
| Watch Time | Total time spent watching a Reel: key for understanding content retention. |
| Engagement-to-Follower Ratio | A performance ratio showing engagement relative to follower count. |
| View-to-Conversion Efficiency | Measures how effectively Reel views lead to actions like follows or clicks. |
| Benchmarking | Comparing performance metrics against competitors or industry standards. |
| Send Time Optimization | The practice of scheduling posts when your audience is most active. |
| Hook Strategy | Tactics used in the first 3 seconds of a Reel to capture attention. |
| Content Fatigue Indicator | Signals declining performance due to repetitive formats or messaging. |
| Reels Funnel Metrics | A metrics set tracking the user journey from discovery to engagement or action. |
| Trial Reel | A Reel published to non-followers only, so you can read its insights before your own audience sees it. |
| Accounts reached | The number of unique accounts that saw a Reel at least once, labelled this way inside Instagram Insights. |
| Skip rate | How often viewers swipe away before finishing a Reel, usually a signal that the hook is too slow. |
| Cross-Platform Cohort Analysis | Evaluates how similar content performs across platforms like TikTok or YouTube Shorts. |
Wrap-up
So, you learned all the details about Instagram’s Reels analytics you need for great reporting in 2026. But let’s give you a quick summary—very briefly.
Impressions and Plays are gone. Views now lead the charge. That changes how you measure engagement, benchmark growth, and prove content value in 2026.
You’ve seen the key metrics that matter: Views, Reach, Watch Time, Completion Rate, Engagements, and Follows. We broke down what each one means and how to use them—no jargon, no guesswork.
You learned how to audit your Reels like a pro, test what actually works, and report results that make sense to clients, bosses, and marketing teams.
But don’t stop at Reels. If you’re serious about reporting, you should also understand Instagram’s full analytics suite—Stories, carousels, profile-level insights, and the whole ecosystem.
📌 In the meantime, try Sociality.io—and make your next Reels report the one that finally gets a “👏 Let’s double this budget.”
And hey—if this blog helped you? Share it on LinkedIn and tag @Sociality.io. We’d love to hear what you’re testing next. 🫶