
Social media ROI tells you whether the time and budget going into social media earn back more than they cost, and most reports can’t answer that because they show reach and engagement but no cost. A social media marketing strategy without a return figure is hard to defend when budgets are set.
We’ve rebuilt this guide around the correct formula, a worked example with real-looking numbers, a free calculator that counts people’s time, and what to report when GA4 and Ads Manager disagree. Let’s get the formula right first, because most ROI arguments start there.
TL;DR / Key takeaways
- ROI subtracts the cost first: in Google’s own example, $1,200 of sales on $800 of total costs is a 50% ROI, not 150%.
- ROAS isn’t ROI: ROAS is conversion value divided by ad cost, so it never sees the people, tools and fees behind the ads.
- People are a growing cost: labor’s share of total marketing budgets rose from 21.9% in 2025 to 24.5% in 2026 (Gartner, 401 marketing leaders), so time belongs in the cost line.
- Attribution settings change the answer: LinkedIn counts conversions up to 90 days after a click or a view by default, while GA4’s reporting attribution model decides which channel gets the credit.
- Social takes a growing share of budgets: marketing leaders put 14.25% of their budget into social media and expect 17.06% within a year (The CMO Survey, 2026).
What is social media ROI?
Social media ROI (return on investment) is what your social media activity earns for every dollar it costs, after that dollar has been paid back. Google defines ROI as the ratio of your net profit to your costs, and the formula follows from that:
Formula: ROI = ((return − cost) ÷ cost) × 100
Return is what social brought in during the period: gross profit from the sales it drove, plus a value for leads and any savings you can document. Cost is everything you spent to get there, from ad invoices to the hours your team put in. Google’s example sells $1,200 of products against $800 of total costs, an ROI of 50%: every dollar spent came back with 50 cents of profit on top.
A common shortcut, revenue ÷ cost × 100, skips the subtraction. On the same numbers it reports 150%, and a month that only covered its costs shows up as a 100% “return”. It’s closer to ROAS than to ROI, and it flatters every report it touches.
The question gets asked more often because the budget behind it keeps growing. Marketing leaders put 14.25% of their marketing budget into social media in early 2026 and expect 17.06% a year later. Proving it has been hard for a while: in February 2020, only 30.0% of CMOs said they had proven social media’s impact quantitatively, and 32.4% hadn’t been able to show it at all.
ROI vs ROAS vs cost per acquisition
ROI, ROAS and cost per acquisition (CPA) all put money next to results, but each one answers a different question, and mixing them up is the quickest way to report a loss as a win.
| Metric | Formula | Question it answers | Use it for |
|---|---|---|---|
| ROI | ((return − total cost) ÷ total cost) × 100 | Did the whole social media effort pay for itself? | Social overall, budget decisions |
| ROAS | revenue from ads ÷ ad spend | How much revenue did each ad dollar bring in? | Paid social campaigns |
| CPA | cost ÷ customers or leads acquired | What did each new customer or lead cost? | Acquisition campaigns, comparing channels |
Google’s Ads help describes ROAS as conversion value per cost, multiplied by 100 when you want it as a percentage, and calls the amount you spend for each sale or lead cost per conversion, or cost per action (CPA).
The catch is that ROAS only sees ad spend. A campaign can return $2.56 for every ad dollar while the people, production and agency fees around it eat the margin, so ROAS looks healthy and ROI sits near zero. Report ROAS for paid campaigns and ROI for social as a whole, and never put one in the other’s column. For the pricing-model side of this, our guide to CPM vs PPC vs CPA covers how each one is billed.
Define the purpose of social media for your brand
If you haven’t done so already, define the main purpose of social media for your brand: brand awareness, new customers, customer service, or staying close to the customers you already have every time a new product comes out. The purpose decides what counts as a return, so it comes before any formula.
- Sales: revenue from orders that came through social, counted at gross profit.
- Leads: enquiries, demo requests or sign-ups, each with an agreed value.
- Customer service: questions answered on social instead of by phone or email.
- Awareness: reach among the right people and more searches for your brand name, which support the ROI case but rarely produce a money figure on their own.
Most brands have two of these, and that’s fine. Agree on them with whoever reads the report, in writing, because a purpose that changes after the results come in will make any ROI figure look arbitrary. It also makes campaigns far simpler to plan.
Set realistic and measurable goals
Goals turn the purpose into numbers. Whether it’s for the month, the quarter or the year, make sure each one is specific and actionable. If the purpose is brand exposure, you can set a number of views you want your content to reach, or an increase measured as a percentage: increase Instagram engagement by 5% in 4 months, or gain 50,000 new followers on X this quarter.
When setting goals, use the SMART framework: specific, measurable, attainable, relevant and time-bound. It keeps targets realistic and gives you a clear line to measure against when the month closes.
Follower and engagement goals are leading indicators. They tell you whether the work is reaching people, but they aren’t a return, so pair each one with the business result it should move, such as orders, leads or support questions answered. Don’t stop at the first metric, though. Check how well the social media metrics you chose predict the result: if your goal is views, track what fraction of the people who saw your posts went on to visit, sign up or buy.
Track social traffic and key events in GA4
Return only shows up in a report if you can trace it back to social. In Google Analytics 4 that takes tagged links, key events and, for actions without a price, a value on each key event.
Tag every link you post with UTM parameters. GA4 reads a fixed set of them: utm_source, utm_medium, utm_campaign, utm_content, utm_term and utm_id, plus utm_source_platform, utm_creative_format and utm_marketing_tactic, the last two of which it doesn’t currently report. Parameters you invent yourself won’t show up. A tagged link looks like this:
https://example.com/offer?utm_source=instagram&utm_medium=social&utm_campaign=autumn-menu&utm_content=reel-pumpkin
The medium decides the channel. GA4 puts a visit in Organic Social when the source is a known social site or the medium is social, sm, social-media or social-network, and in Paid Social when a social source comes with a paid medium such as cpc, ppc or anything starting with “paid”. Tag ads with utm_medium=paid_social and organic posts with utm_medium=social, and keep every link in one spreadsheet so the names stay consistent. Google’s URL builder fills in the parameters for you.
Next, mark the actions that matter as key events: a purchase, a demo request, a newsletter sign-up. For actions without a price, GA4 lets you assign a default monetary value to a key event, so a lead counts as money in the reports.
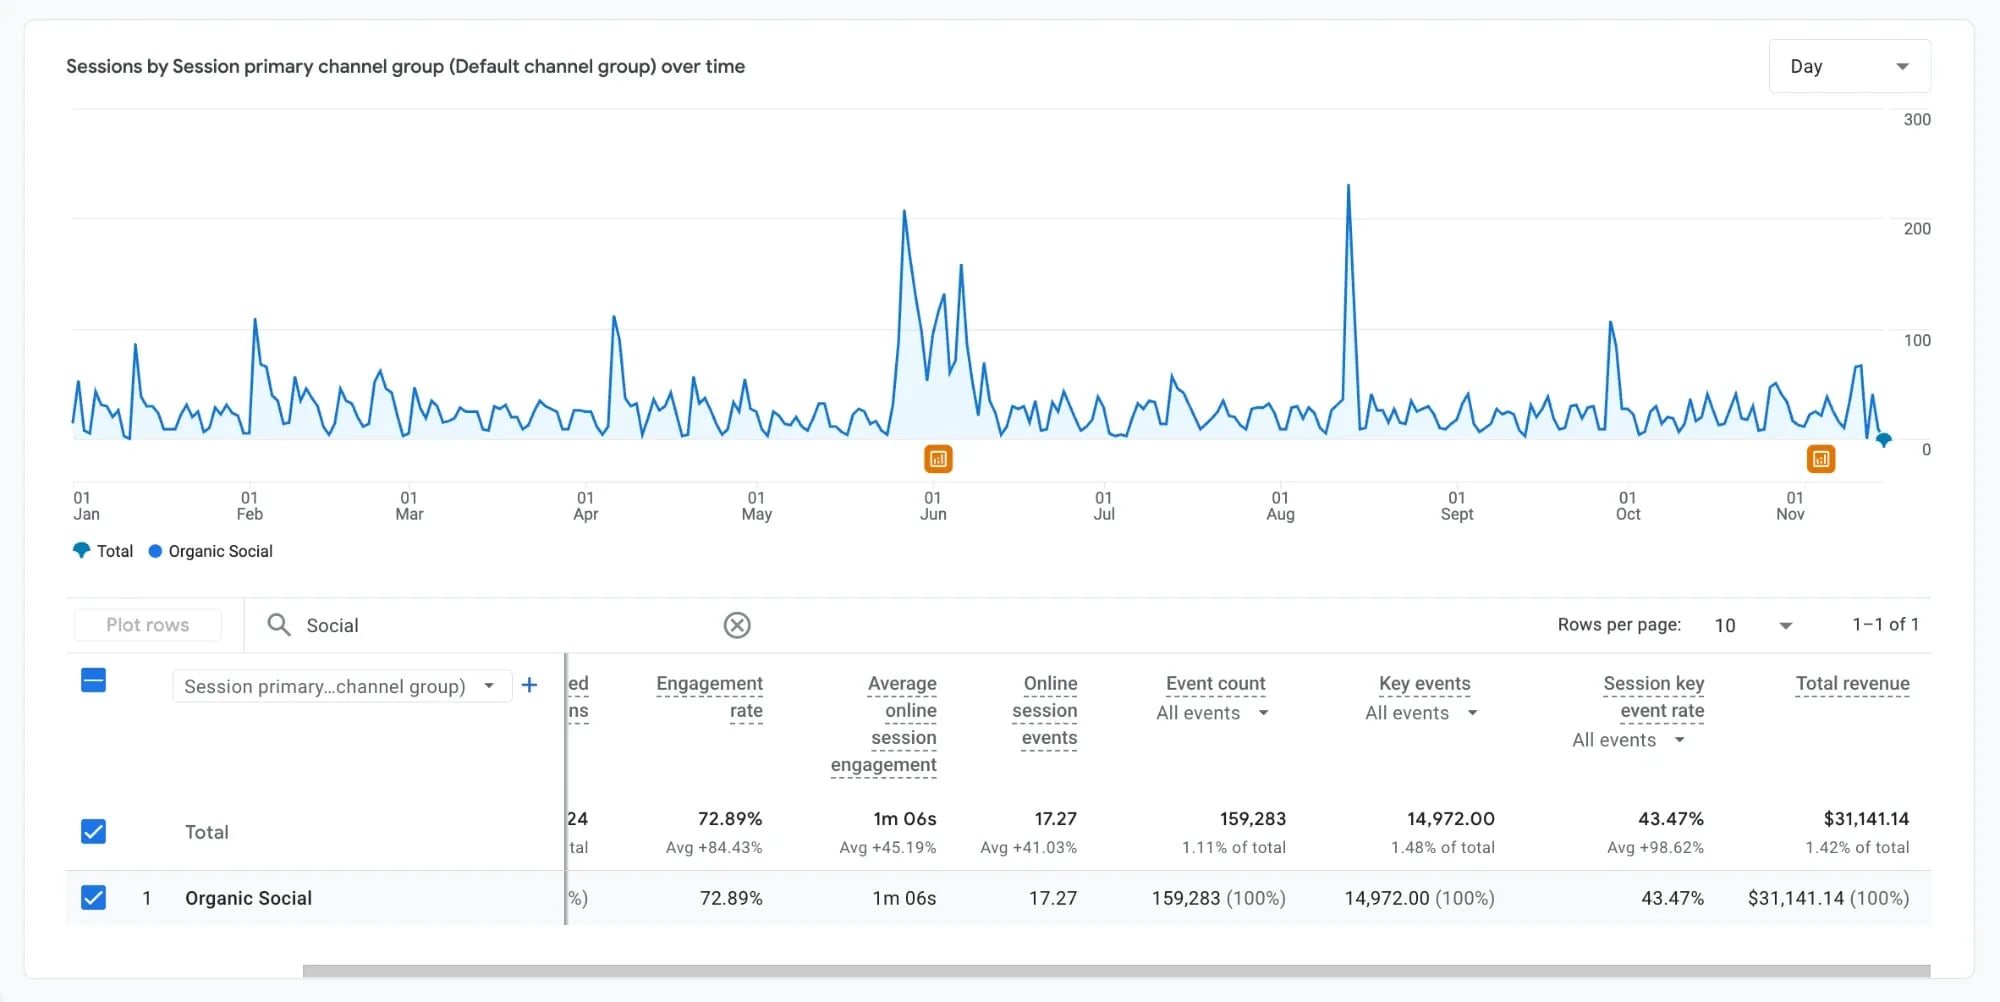
Then open Reports > Acquisition > Traffic acquisition, where the primary dimension is Session primary channel group (Default channel group). The Organic Social row shows sessions, key events and revenue side by side, and Paid Social gets a row of its own once your ads carry a paid medium.
Add up costs and returns
Cost is everything the social media work took during the period, not only the ad invoices. Labor’s share of total marketing budgets rose from 21.9% in 2025 to 24.5% in 2026 in Gartner’s survey of 401 marketing leaders, and a report that leaves people’s time out overstates ROI every single month. Count:
- Ad spend on every platform, taken from billing rather than from the budget you planned
- People’s time: hours × a loaded hourly cost (salary plus overhead), including planning, replying to comments and reporting
- Tools and subscriptions: social media management, design, stock, link tracking
- Content production: freelancers, shoots, video editing, creator fees
- Agency fees, if an agency runs part of the work
Return is what the period brought back in money, counted once:
- Gross profit from sales attributed to social (revenue × gross margin), because revenue alone ignores what the products cost to make
- The value of leads and sign-ups that haven’t bought yet
- Support costs you can show you saved
Google’s way to value a lead is simple: if 1 in 10 leads becomes a $20 sale, each lead is worth $2. Use your own close rate and average deal, and keep lead value in its own line until the sale closes. Otherwise the same customer gets counted twice, once as a lead and again as revenue.
Be strict with savings. Fewer support tickets in a month isn’t proof on its own, so count the conversations that moved to social and the cost difference you can document, or leave the line empty.
Example: Northside Coffee’s ROI for October
Here’s the whole method on one month. Northside Coffee is a fictional café brand (the same one in our KPI tracker) and the numbers are made up, but they’re the kind I’d expect from a small in-house team running Instagram with a modest ad budget.
| October | Amount |
|---|---|
| Ad spend | $800 |
| People’s time (66 hours × $35) | $2,310 |
| Tools and subscriptions | $250 |
| Content production | $500 |
| Total cost | $3,860 |
| Revenue from social in GA4 | $4,900 |
| Gross profit at a 65% margin | $3,185 |
| 10 catering leads × $100 | $1,000 |
| Total return | $4,185 |
ROI = ($4,185 − $3,860) ÷ $3,860 × 100 = 8.4%
Paid social on its own brought in $2,050 of revenue from $800 of ads, a ROAS of 2.56. Cost per acquisition across 35 orders and 10 leads is $85.78, and paid social alone got 14 conversions at $57.14 each.
So which number goes to the owner? The ads clearly worked. Social as a whole barely paid for itself, because time was 60% of the month’s cost. Run the shortcut (revenue ÷ cost × 100) on the same month and you’d report 127%, the kind of number that gets a budget approved and then questioned three months later.
What I’d change isn’t the ad budget. It’s the 66 hours: if better scheduling and a reporting template saved 15 of them, the same month would show an ROI of about 25%.
Free social media ROI calculator
We built a calculator around the Northside Coffee numbers so you can run the same math on your own. It’s an Excel file with four tabs:
- Start here: how it works and the colour key
- Inputs: one row per cost and return, one column per month, each with a note on where the number comes from
- ROI tracker: total cost, return, net return, ROI, ROAS and cost per acquisition for every month and the year to date
- Formulas: what each number means and what can mislead you
It counts people’s time, gross margin and lead value, because ROI without them is mostly ROAS. Paid revenue and paid conversions sit in their own rows, so ROAS and paid CPA never borrow from organic results. Replace Northside’s numbers with yours and leave the grey cells alone.
Attribution: why Ads Manager and GA4 disagree
Ads Manager says 40 conversions, GA4 says 12, and the client wants to know which one is real. Usually both are, by their own rules.
Each ad platform counts conversions inside its own attribution window and only sees its own ads, so three platforms can each claim the same sale. LinkedIn recommends, and defaults to, a 90-day click and 90-day view window for most conversions, which means someone who saw an ad in August and bought in October can still count. TikTok lets advertisers choose click windows of 1 to 28 days and view windows of up to 7 days for each ad group.
GA4 sees every channel but credits them by the model in its reporting attribution setting: data-driven, paid and organic last click, or Google paid channels last click. The setting changes how key events and revenue are credited in attribution reports, while session and user source dimensions stay as they are. Rule-based models such as first click and linear were removed in November 2023.
What to report:
- One baseline for conversions and revenue, usually GA4 or your CRM, with the attribution model written on the slide
- Platform-reported conversions in their own column, for comparing campaigns, never added to the baseline
- Assisted conversions from Advertising > Attribution > Attribution paths, to show where social played a part before the last click
An assisted sale is still one sale, so it doesn’t go into the return line a second time. If the gap between the two numbers jumps from one month to the next, check the boring causes first: a missing UTM, a changed window or a new key event.
How to show ROI when there’s no direct sale
Not every social program sells something the same day. Awareness campaigns, B2B accounts with six-month sales cycles and community or support teams still cost money, and the ROI question still comes. The honest answer splits the return into three parts and labels each one:
- Confirmed money: closed deals and orders you can trace to social
- Estimated value: qualified leads and open opportunities at an agreed lead value, shown apart from confirmed money and replaced by the real figure when the deal closes
- Evidence without a price: reach among the right audience, more searches for your brand name, demo requests from people who first found you on LinkedIn, fewer repeat questions to support
For B2B, follow the chain from social to qualified lead, opportunity and sale in your CRM and report lead value every month; the closed revenue arrives later and replaces the estimate. For support, count conversations resolved on social at the cost difference you can document.
Two habits make these reports worse. One is turning followers or likes into dollars. The other is pricing organic reach at what the same impressions would cost as ads (impressions × CPM), which tells you what the reach would have cost to buy, not what it earned.
If you can’t put a defensible number on the return yet, say so and report progress toward the outcome instead. You’d be in large company: in 2020, 37.6% of CMOs said they had a good qualitative sense of social media’s impact but no quantitative proof.
How to report social media ROI every month
A manager or client shouldn’t need forty slides to find out whether social paid off. One summary slide does it:
| Row | What goes in it |
|---|---|
| Investment | Total cost, split into paid and organic work |
| Return | Confirmed revenue at gross profit, estimated lead value and documented savings, each on its own line |
| Efficiency | ROI for social overall, ROAS and cost per acquisition for paid |
| Trend | This month vs last month, plus a rolling three-month ROI |
| Notes | The attribution model, what changed and what you’ll do next |
Keep the definitions fixed from month to month: the same key events, the same attribution model, the same hourly rate. The rolling three-month figure matters because sales lag, so a September campaign can close deals in November and one month on its own will swing more than the business does. Money is the language at the top, too: in The CMO Survey 2026, 75.0% of marketing leaders said they demonstrate the financial impact of marketing to show its value to other teams.
Agencies can use one template for every client but keep each client’s goals, hourly rates and lead values separate. The client report structure in our AI reporting guide shows where ROI sits next to the rest of the numbers.
When ROI drops, name the drop before explaining it, then check whether costs went up, confirmed returns went down or deals are still in the pipeline. Our note on explaining a drop in performance walks through the order to check things in.
Social media ROI reporting with Sociality MCP
The money side of ROI comes from GA4 and your invoices. The social side, meaning which posts drove results and how much of that was bought, is where most of the monthly export work goes, especially for an agency with ten clients.
With Sociality MCP, our social media MCP server, ChatGPT, Claude or Gemini Enterprise can read the posts and stats of the accounts you manage and the competitors you track, including how many of each post’s likes and comments were paid and how many organic. Its account and competitor tools read data, apart from connecting an account or adding a competitor. I pulled October’s posts for a brand that promotes a lot of its content with a prompt like this:
Using Sociality MCP, pull Starbucks’ Instagram posts from October 2026. For each post, split likes and comments into paid and organic, then tell me what share of the month’s likes and comments was paid and which posts relied most on paid.
Starbucks promoted 17 of its 19 October posts, and 36.5% of the month’s 1,817,800 likes and comments were paid. The split swings a lot by post: its best post, a 21 October Reel with 353,091 likes and comments, was only 11% paid, while a 14 October Reel was 85% paid.
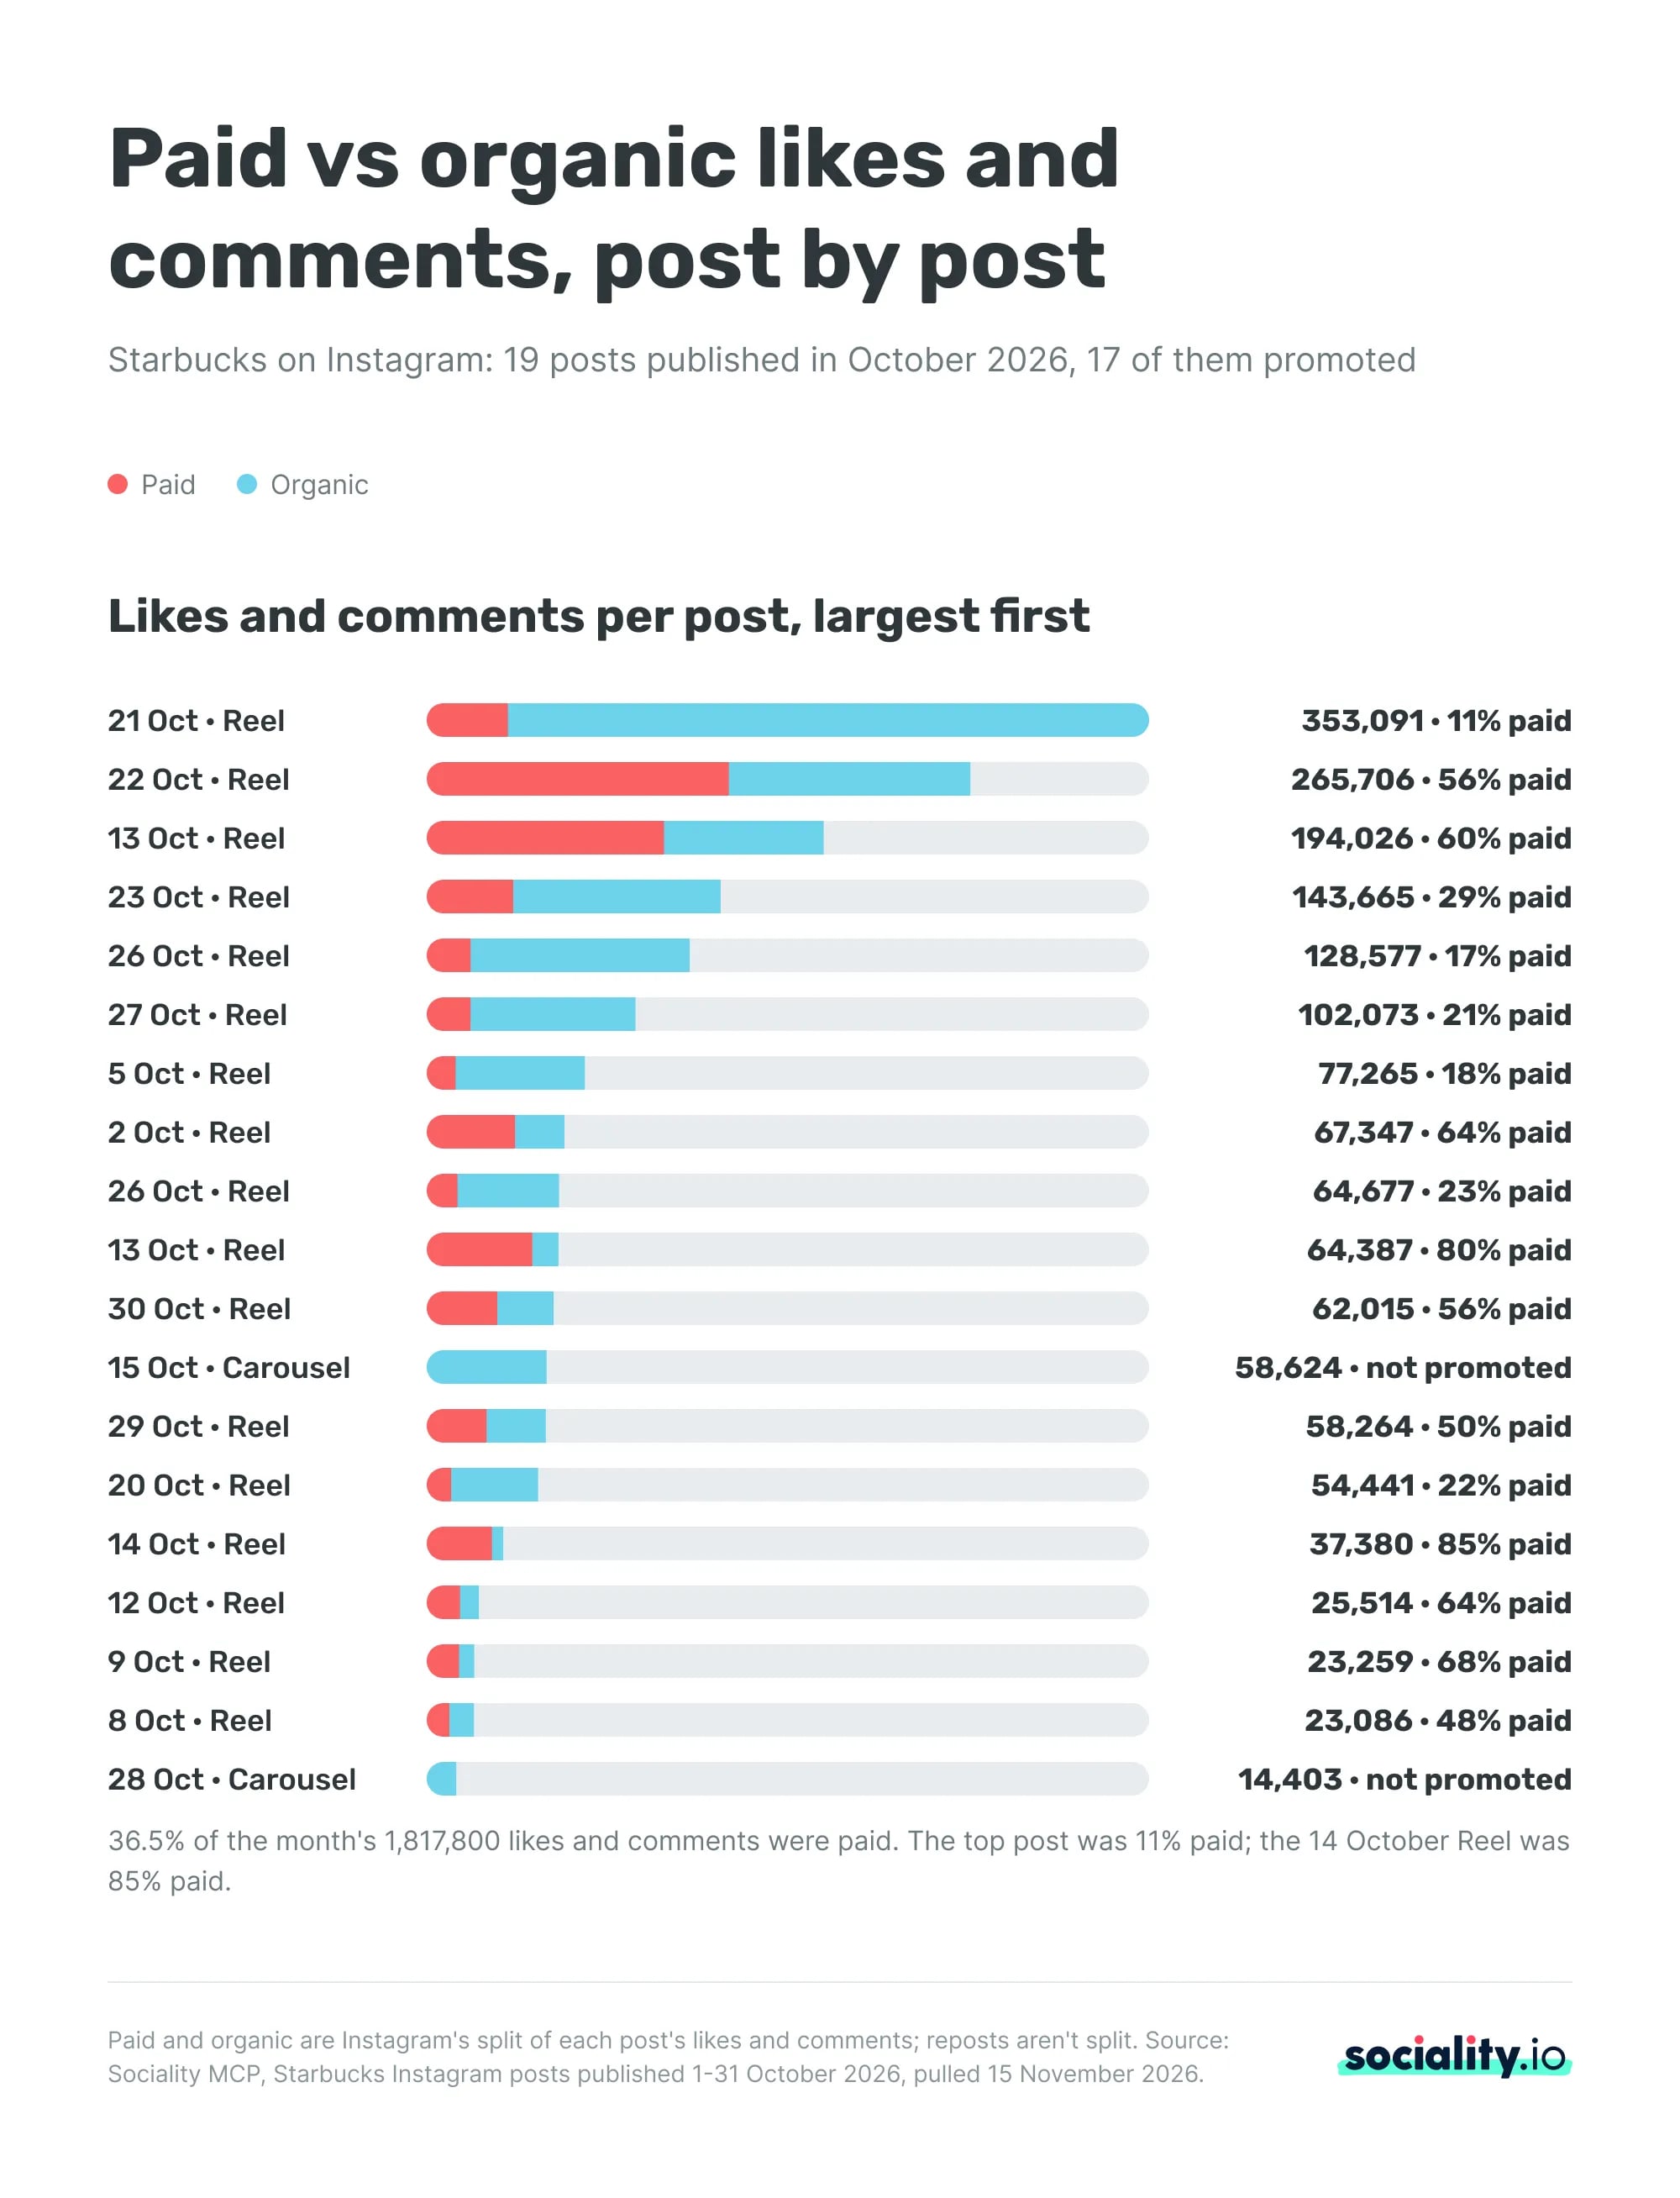
That matters for ROI. Credit every result on a promoted post to the ad spend and ROAS looks better than it is; credit them all to the content team and organic seems to do the ads’ work. A per-post split gives each cost line something honest to sit against. Sociality MCP doesn’t see revenue or website conversions, so the money still comes from GA4 or your sales data.
Social media ROI FAQs
Which tool shows paid and organic social results for ROI reporting?
You need post-level results split into paid and organic for every account you report on, plus revenue from GA4 or your CRM. Sociality.io compares organic and promoted Instagram posts side by side and sends scheduled reports in XLSX, PPT or PDF, and Sociality MCP lets ChatGPT or Claude pull the paid and organic split per post for the accounts and competitors you track.
What does a negative social media ROI mean?
A negative social media ROI means the return you can measure was smaller than the total cost of the work, so social didn’t pay for itself in that period. It doesn’t always mean social failed: sales from a campaign can land weeks later, and new leads may not have a value yet. Check the cost lines, the lead value and a rolling three-month ROI before cutting anything.
How do you calculate social media ROI?
Subtract total cost from total return, divide by total cost and multiply by 100: ((return − cost) ÷ cost) × 100. If social brought in $4,185 of gross profit and lead value in a month and cost $3,860 in ads, time, tools and content, the ROI is 8.4%. Dividing revenue by cost without subtracting would report 127% for the same month.
When should you report ROAS instead of ROI?
Report ROAS when the question is about a paid campaign: which ad set, audience or creative turned ad spend into the most revenue. Report ROI when the question is whether social media as a whole paid for itself, because only ROI counts people’s time, tools, content and agency fees. Most monthly reports need both, in separate rows, and never added together.
What is a good social media ROI?
Any ROI above zero means social earned back more than it cost, but there’s no single benchmark worth promising, because margins, sales cycles and what counts as cost differ so much between businesses. Compare your ROI with your own previous months and with other channels measured the same way, and use a rolling three-month figure so one slow month doesn’t decide the budget.
How do you measure the ROI of organic social media?
Count the cost first: the hours spent planning, creating, publishing, replying and reporting, at a loaded hourly rate, plus tools and production. Then measure the return from Organic Social in GA4, using sales, key events with a value for leads and any support savings you can show. If organic doesn’t lead to a defensible money figure yet, report its outcomes without inventing a percentage.
Why do Meta Ads Manager and GA4 show different conversions?
They count by different rules. Ads Manager only sees Meta’s ads and credits conversions by the attribution setting in your ad account. GA4 sees every channel it can track and credits them by its own reporting attribution model. First check that you’re comparing the same event and the same dates, then report one baseline and show Meta’s number in its own column.
Is there a free social media ROI calculator?
Yes. Sociality.io’s free ROI calculator for social media is an Excel file with monthly inputs for ad spend, people’s time, tools, content and agency fees, and for revenue, gross margin, leads and lead value. It calculates ROI, ROAS and cost per acquisition for every month and the year to date. It comes filled in with a fictional example brand, so replace the numbers with yours.