

Facebook analytics 2026: tools, metrics, reports + free template
Summarize this article via
If Facebook analytics feels more complicated than it used to, there’s a reason for that. Meta’s insights are spread across different dashboards, and the numbers don’t always tell the same story unless you know what each one is designed to measure.
Instead of keeping a separate social media analytics platform, Meta funneled measurement into the tools businesses were already using: Meta Business Suite, Ads Manager, and Events Manager.
That didn’t make analytics less important, far from it. With Meta’s Family of Apps averaging 3.43B daily active people (March 2025) and reporting $42.31B in Q1 2025 revenue, marketers rely on these tools more than ever to understand performance and prove ROI.
In this guide, I’ll break Facebook analytics down into a clear workflow. You’ll learn where to check your metrics, how to interpret them, how to turn them into a report stakeholders actually understand, and the latest FB analytics updates!
Quick takeaways:
- “Facebook Analytics” is gone; use Business Suite Insights + Ads Reporting
- Facebook Analytics was sunset in 2021 — replaced by Business Suite, Ads Manager, and Events Manager.
- Professional Dashboard is now the go-to for Page-level metrics.
- Pixel + Conversions API keep ad attribution alive post-iOS 14.
- Third-party platforms (like Sociality.io) give you cross-network reporting in one Facebook analytics dashboard.
Hey!
Do you want cross-network reporting without tab-hopping? Try Sociality.io free for 14 days. I promise, you’ll regret not trying it sooner.
- What happened to Facebook Analytics? 😱
- Where “Facebook Analytics” lives now in 2026?
- Facebook metrics 2026: Page insights (What to check 🕵️♀️)
- Facebook ads analytics: How to read paid performance
- Facebook ad analytics: Attribution & signal quality (Pixel + CAPI)
- How to see analytics on Meta (step-by-step)
- Facebook analytics tools (A quick list ✅)
- Facebook analytics report: A simple template
- How to build a Facebook analytics dashboard (fast)
- Where AI fits into Facebook reporting workflows
- Sociality.io: How to get analytics for Facebook (The best way 🩵)
- 2026 Facebook analytics updates
- Mini glossary
What happened to Facebook Analytics? 😱
As I mentioned in the intro, back in July 2021, the Facebook Analytics tool was gone for good.
Officially, Meta said it was about consolidating business tools into Business Suite and Ads Manager. But here’s the full story:
- Low adoption: Few marketers relied on it daily when Ads Manager and Page Insights were more familiar.
- Privacy changes: Apple’s App Tracking Transparency (iOS 14) made cross-app tracking harder, limiting its usefulness.
- Feature overlap: Funnels, demographics, conversions — already available elsewhere.
Marketers had until June 30, 2021, to export reports as CSVs. Many learned the hard way: if your analytics workflow isn’t portable, you’re one policy update away from disruption.
Where “Facebook Analytics” lives now in 2026?
Facebook didn’t kill analytics — it just scattered them across different dashboards. Here’s where they live now.
1.Insights → Meta Business Suite
Meta Business Suite is now the central hub for Facebook and Instagram analytics. Its Insights tab shows post reach, engagement, content performance (top posts), and audience demographics across both platforms. You’ll also find trend dashboards for both organic and paid results.
You can access it on desktop (business.facebook.com) or via the mobile app. It consolidates most features from the old Creator Studio and Page Insights, making it a one-stop shop for publishing, messaging, and analytics.
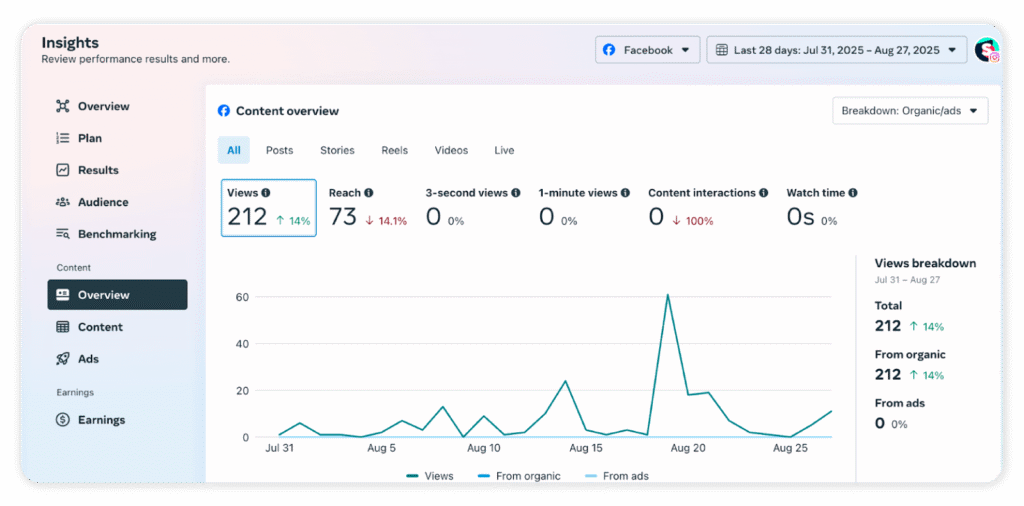
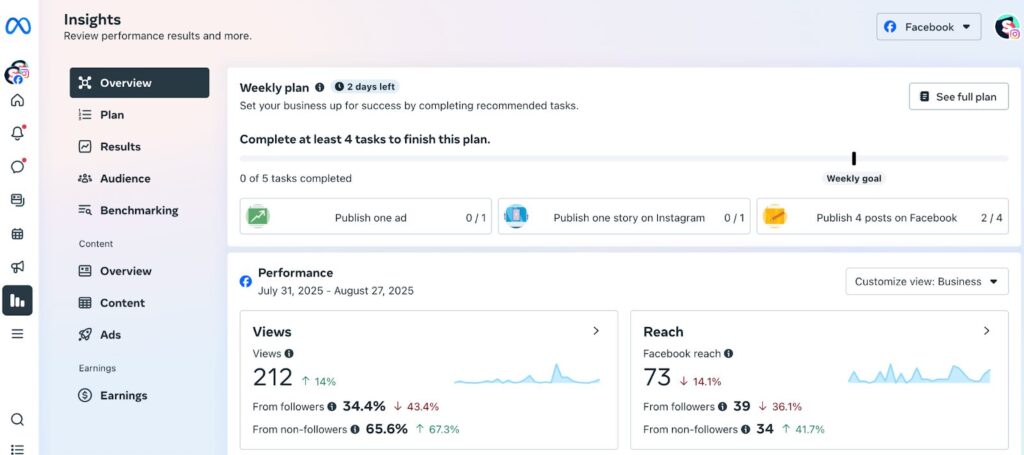
Sub-tabs like Overview, Results, and Content give you a simple snapshot of how your performance evolves over time. Meanwhile, the Audience tab helps you truly understand who’s behind the numbers—age, gender, location—because data only matters when it brings you closer to your community.
2.Pages → Professional dashboard
For the new Pages experience or professional mode, the in-app Professional Dashboard gives you a snapshot of Page growth and engagement.
Key metrics include:
- Follower growth & page likes
- Post reach & engagement
- Audience demographics
The Home tab gives you a quick 7–90 day snapshot of performance—perfect for fast check-ins. But when you need deeper exports and more detailed views, Business Suite is where the real insights live.
3.Ads manager / Ads reporting
When it comes to Facebook ads analytics, your go-to tool will be Meta Ads Manager (and its Ads Reporting features).
Here’s a brief YouTube video explaining how to use Meta Ads Manager:
So, with Ads Manager, you can:
- Customize columns to focus on KPIs.
- Filter/break down by campaign, audience, or placement.
- Use saved reports or schedule automatic recurring reports via Ads Reporting.
In Ads Manager, you’ll find default column presets (Performance, Engagement, Video, etc.), but you can click “Customize Columns” to create your own view with the exact metrics you need.
For instance, a marketer focused on conversions might add columns for Purchases, Cost per Purchase, and ROAS, whereas one focused on traffic might emphasize CTR and CPC. Ads Manager also includes robust reporting capabilities: you can create saved reports and even schedule recurring reports to be emailed to your team on a daily, weekly, or monthly basis.
Ads Reporting even lets you build custom pivot tables or charts — and email them on autopilot to your team every week. No more late-night data pulls.
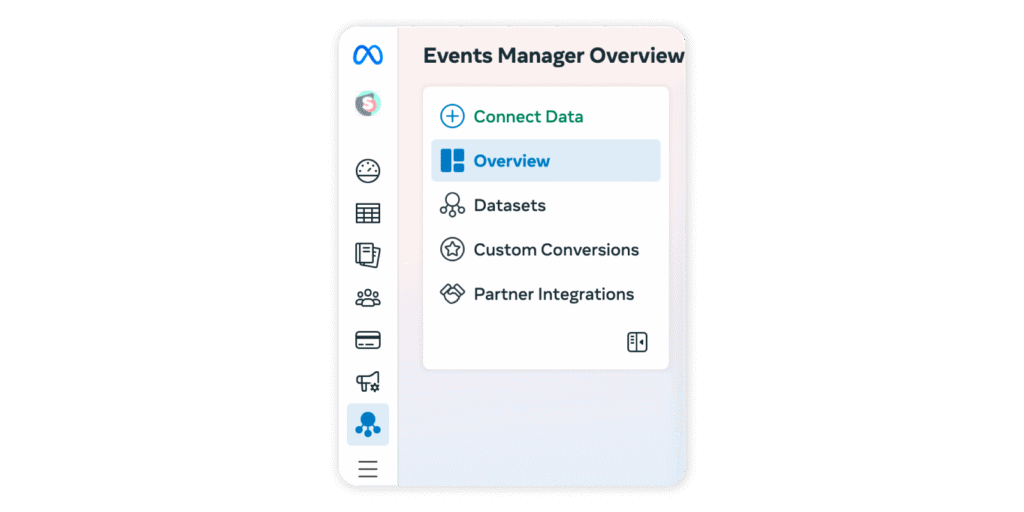
4.Events Manager (Pixel + Conversions API)
Events Manager tracks conversions through Meta Pixel and the Conversions API—so you see the actions that truly matter.
You can:
- Verify that events like Page Views, Leads, and Purchases are firing correctly.
- Check event match quality and deduplication between Pixel and server-side data.
Troubleshoot issues like missing or duplicate events.
Without clean Pixel + CAPI data, Meta is basically guessing. Events Manager is where you double-check the signals your ads depend on.
5.Creator Studio → Rolled into Business Suite
Creator Studio was phased out in 2022–2023, with its features—scheduling, content library, monetization insights, and analytics—now living inside Meta Business Suite.
Marketers still get video and post performance data plus audience insights, but in a single, unified dashboard instead of juggling tools.
We’ve mapped out the landscape of Meta’s analytics. Now let’s zoom in on what those numbers really mean—starting with Page Insights.
Facebook metrics 2026: Page insights (What to check 🕵️♀️)
Page Insights is where you see the story behind your Facebook Page. It shows who’s finding you, how they interact, and which content keeps them engaged. Think of it as your quick health check — the place marketers go to spot organic growth, track campaign impact, and understand what’s really driving activity on the Page.
Overview
The Overview tab gives you a snapshot of overall Page health:
- Total reach and engagement for the selected time period
- Net new followers and likes
- A quick look at your most recent posts and how they performed
Think of this as the “pulse check” of your Page. For deeper trend analysis, many teams combine Page Insights with Meta Business Suite dashboards.
Followers & likes
This section tracks your community’s growth—and reminds you that real success is about building connections that endure.
- Organic vs. paid followers help you see how much of your growth comes naturally versus through promotions.
- Net growth vs. unfollows tells you if you’re winning fans — or quietly driving them away.
- Where follows happen (search, mobile, or directly on your Page) reveals the main entry points.
But follower growth is only half the picture.
A Page can gain hundreds of new likes and still struggle to get seen in the feed. That’s where understanding the difference between reach and impressions comes in — it shows how visibility and audience growth work together to paint the full picture of Page performance.
Reach
Reach analytics focus on how many people saw your content and how they reacted:
- Organic vs. paid reach
- Post engagement: likes, shares, comments
- Negative feedback: hides, spam reports, unlikes
This is where you can separate “vanity metrics” from impact. If reach is high but engagement is low, it may be time to adjust your content strategy — perhaps testing formats like Facebook Stories for more interactive reach.
Page views & actions
Here you can see who’s visiting your Page and what they do once they arrive:
- Views by section (timeline, about, jobs, etc.)
- Visitor breakdowns by age, gender, location, and device
- Actions taken: button clicks (call, website, directions), product views, or form fills
This insight helps optimize the basics: if mobile views dominate, make sure your CTAs and landing pages are mobile-friendly.
Posts, videos & stories
This tab shows how different types of content resonate:
- Best posting times — when your audience is most active
- Content type performance — compare photos, links, videos, carousels
- Video retention — average watch time and drop-off points
- Stories engagement — replies, taps forward/back, exits
If you publish regularly, consider scheduling content with the successor of Facebook Creator Studio inside Business Suite, or use third-party tools like Sociality.io for multi-platform analysis.
I’d love to help you make up your mind to choose your go-to social media analytics tool. Naturally, Sociality.io is my top pick thanks to its powerful analytics, AI-driven ease of use, predictable pricing, and competitor analysis—but words alone don’t prove much.
So here’s my suggestion: check out these Hootsuite alternatives, where I evaluate each tool’s analytics, management features, UX, pricing, customer support, and benchmarking, alongside real user feedback and ratings. Then you can choose the best fit for your business needs.
Messages, events & product posts
Beyond content, Page Insights also highlights direct interactions:
- Messages — track response rates and response times (critical for customer service SLAs)
- Events — RSVPs, responses, and ticket clicks
- Product-tagged posts — performance of shoppable posts from your Facebook Shop
These metrics matter if your Page doubles as a storefront or customer support hub. Combined with tools like Facebook Pixel, you can tie on-platform actions to downstream conversions.
👉 Key takeaway: Page Insights is your foundation for Facebook Page analytics. It won’t replace advanced dashboards, but it gives quick visibility into audience growth, post performance, and customer engagement—all data marketers can act on today.
Organic stats only take you so far. To see if your budget is really pulling its weight, you need to dive into Facebook ads analytics.
Facebook ads analytics: How to read paid performance
Ads Manager is your command center. It’s where every impression, click, and conversion gets tracked — and where you’ll find the insights to make your budget work harder.
Think of ad analytics in four buckets:
1.Delivery metrics
These show how often your ads are being served and to whom.
- Reach — the number of unique people who saw your ad.
- Impressions — total times your ad was shown (reach × frequency).
- Frequency — average number of times each person saw your ad.
❗️If frequency climbs but conversions stall, your audience may be experiencing ad fatigue. That’s your cue to refresh creatives or expand targeting.
2.Engagement & traffic metrics
This is where you measure whether your ad actually sparks action.
- CTR (click-through rate): Percentage of people who clicked after seeing your ad.
- CPC (cost per click): Average cost for each click.
- Landing page views: How many people clicked and waited for your page to load.
3.Efficiency metrics
Here’s where ROI comes into play.
- CPA/CPP (cost per acquisition/result): How much you’re paying for a specific outcome (e.g., a lead or purchase).
- ROAS (return on ad spend): Revenue generated for every dollar spent.
👉If you hae high CTR but poor ROAS? That usually means your targeting or creative is strong, but your offer or landing page needs work.
4.Quality metrics
Not all conversions are created equal. These metrics highlight the value of actions taken.
- Conversion rate: Percentage of users who completed the desired action after clicking.
- Cost per add-to-cart/checkout: Useful for ecommerce brands tracking funnel health.
💡Create saved reports in Ads Reporting and schedule weekly emails to stakeholders.
Facebook ad analytics: Attribution & signal quality (Pixel + CAPI)
If you want to prove what your ads are really worth, attribution is the missing link. It connects ad exposure to the actions that matter — from add-to-carts to purchases.
The Meta Pixel is the classic setup. Installed on your site, it tracks events like page views, carts, and checkouts. But since Apple’s iOS 14 update and the rise of privacy-first browsers, relying only on the Pixel means gaps in your data.
In fact, 88% of iOS users worldwide—and 96% in the U.S.—opted out of Facebook tracking after Apple’s App Tracking Transparency rollout, creating major blind spots.
That’s why Meta introduced the Conversions API (CAPI). Instead of relying on browsers, it sends events directly from your server, making reporting more resilient against ad blockers and privacy changes.
When Pixel and CAPI run together, you get:
- Deduplicated events → no double counting
- Higher match quality → cleaner signals to optimize delivery
👉 For marketers, the takeaway is clear: Pixel + CAPI is the foundation of reliable Facebook ad analytics in 2026.
🎁BONUS: Video guide to analyze Facebook Analytics in 2026
How to see analytics on Meta (step-by-step)
Meta scattered its analytics across a few dashboards. Here’s exactly where to click depending on your goal:
Organic performance
- Open your Facebook Page
- Click Professional dashboard → Insights
- Review followers, reach, and engagement
- For cross-platform data, switch to Meta Business Suite → Insights
Paid campaigns
- Go to Ads Manager
- Select your campaign/ad set/ad
- Click Columns → Customize and add CTR, CPC, CPA, ROAS (whatever matches your goal)
- Save the view as a report and schedule weekly email delivery
Conversions
- Open Events Manager
- Choose your Pixel/CAPI source
- Check Diagnostics → Event Match Quality
- Use Test Events to confirm add-to-cart, checkout, and purchase are firing correctly
Those are the clicks you need to get the basics. But Meta’s native tools aren’t the whole ecosystem. Marketers often mix them with other analytics platforms for a fuller picture.
Facebook analytics tools (A quick list ✅)
Not everything has to stay inside Meta. Depending on your goals, here are the tools marketers actually use to keep Facebook performance visible:
- 👉Meta Business Suite (Insights): Free and native. Perfect for checking organic reach, engagement, and audience breakdowns across Facebook and Instagram in one dashboard.
- 👉Meta Ads Reporting: The backbone for paid campaigns. Customize columns around your KPIs (CTR, CPA, ROAS), save reports, and schedule them straight to your inbox.
- 👉Meta Events Manager: Your conversion command center. Pixel and CAPI diagnostics ensure your tracking is firing and your attribution is clean.
- 👉Google Analytics 4 (GA4): Connect it to track what happens after people click from Facebook to your website — bounce rates, conversions, and multi-touch journeys.
- 👉Third-party platforms: Tools like Sociality.io, Hootsuite, or Buffer consolidate multiple networks into one place. They shine when you need cross-channel dashboards, competitor benchmarking, or automated reporting.
Facebook analytics report: A simple template
Most stakeholders don’t want to scroll through endless dashboards. They want the story: what you spent, what you got, and what to do next. That’s why a clean, structured Facebook analytics report matters.
And increasingly, AI is helping teams turn dashboards into stories. In Sociality.io’s 2026 AI in social media marketing survey, 59.5% of marketers said they use AI for analytics and reporting, mainly to summarize performance and surface patterns faster.
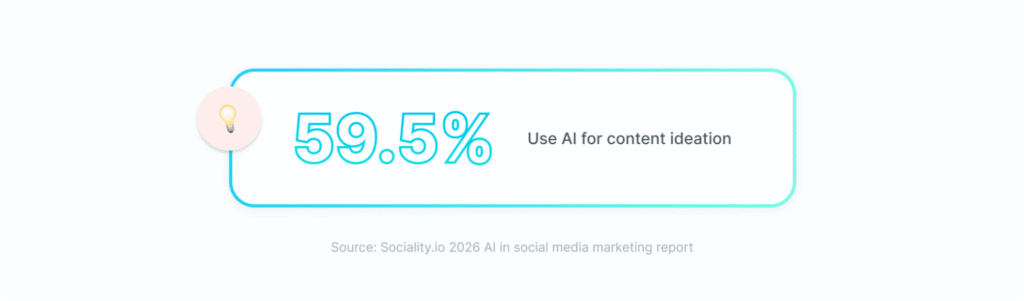
But speed doesn’t replace verification, 78.4% apply moderate or extensive editing before publishing AI-assisted outputs. The same rule applies to Facebook reports: use AI to structure insights, but validate every metric against Ads Manager, Business Suite, and Events Manager.
I’ve created a simple template below, but we also offer you a free Facebook Analytics report template. Don’t forget to download it!
- Executive summary — Open with campaign goal, spend, and the outcome in one or two sentences. Example: “Q3 objective was lead gen. We spent $5,000, drove 1,200 leads at $4.16 CPA, and achieved 3.2 ROAS.”
- Organic performance — Highlight Page reach, engagement rate, and top-performing posts. Screenshots from Business Suite Insights work perfectly here.
- Paid performance — From Ads Manager, add CTR, CPC, CPA, and ROAS. Use saved reports so you can drop the numbers in without manual digging.
- Audience — Summarize follower growth, demographics, and top locations. Great for showing whether your targeting is bringing in the right people.
- Conversions — Pull diagnostics from Events Manager. Confirm Pixel and CAPI are tracking purchases or leads correctly, and flag any gaps.
- Next actions — End with 2–3 recommendations: which creatives to scale, which audiences to test, and where to shift budget.
How to build a Facebook analytics dashboard (fast)
- Define questions first: “Which post type drives highest CTR?”
- Map data sources: Insights (organic), Ads Reporting (paid), Events Manager (conversions).
- Assemble weekly: import CSVs → calculate KPIs → annotate results.
- Share: export PDF or PPT, add context for stakeholders.
Where AI fits into Facebook reporting workflows
AI is already showing up inside social analytics work, not as a replacement for Ads Manager or Business Suite, but as a faster way to turn messy dashboards into clear decisions.
In Sociality.io’s 2026 AI in social media marketing survey, 59.5% of marketers said they use AI for analytics and reporting. For Facebook reporting specifically, that usually means using AI to speed up the “so what?” part of the work.
1) AI for summarizing performance trends (without living in spreadsheets)
Most Facebook reports follow the same loop: pull data → scan columns → write a story.
AI can compress the middle step.
Teams use it to:
- Summarize week-over-week shifts (reach, engagement, CTR, CPA)
- Compare ROAS and cost trends across campaigns
- Flag unusual drops in reach, CTR, or conversion rate
- Draft stakeholder-ready executive summaries based on the numbers you provide
2) AI for connecting creative to outcomes
Facebook performance rarely changes “randomly.” It usually moves because the creative, audience, or delivery changed.
AI helps you spot patterns like:
- Did video outperform static this month?
- Did higher frequency correlate with rising CPA (aka creative fatigue)?
- Did organic engagement spikes align with campaign launches or content themes?
When you’re pulling inputs from Business Suite (organic), Ads Manager (paid), and Events Manager (conversions), AI can help you connect the dots—especially when you add campaign notes.
3) AI for faster reporting (but not blind trust)
Time savings is the biggest win. In the same survey, 71.1% of marketers said AI saves them time.
But speed only matters if the output is still reliable.
Also from the survey:
- 50% cite accuracy/reliability concerns
- 78.4% apply moderate or extensive editing before publishing AI-assisted work
That rule applies to analytics, too.
Use AI to:
- Draft summaries
- Structure insights
- Suggest explanations and next steps
- Flag anomalies worth investigating
Keep humans responsible for:
- Verifying ROAS, CPA, and conversion counts
- Confirming Pixel + CAPI tracking is healthy
- Adding business context (budget shifts, promos, seasonality)
- Signing off on conclusions
4) Why signal quality matters even more when AI is involved
AI can summarize whatever you feed it—even if the data is wrong.
If:
- Pixel events aren’t firing correctly
- CAPI deduplication is off
- Event Match Quality is low
…your report might look “clean,” but it’ll be confidently based on flawed attribution.
That’s why Pixel + CAPI + Events Manager diagnostics are a big must in 2026. They simply are the foundation of reporting you can trust, especially if AI is helping you move faster.
Sociality.io: How to get analytics for Facebook (The best way 🩵)
Managing Facebook analytics across multiple tabs is exhausting. That’s why teams switch to Sociality.io — an all-in-one platform built to simplify reporting, engagement, and growth.
Why teams choose it
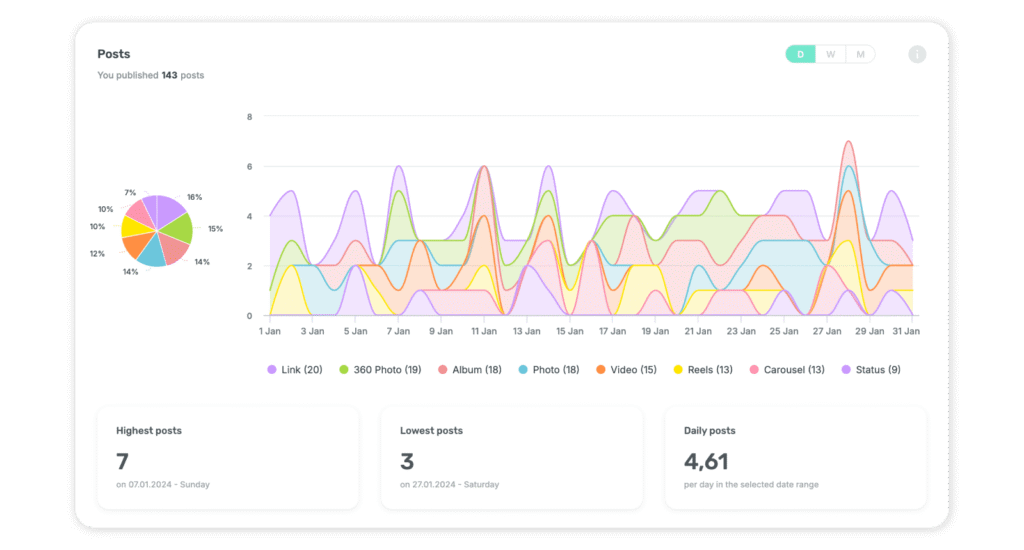
- Post-level intelligence — see reactions, impressions, and which content types (video, carousel, link) actually resonate.
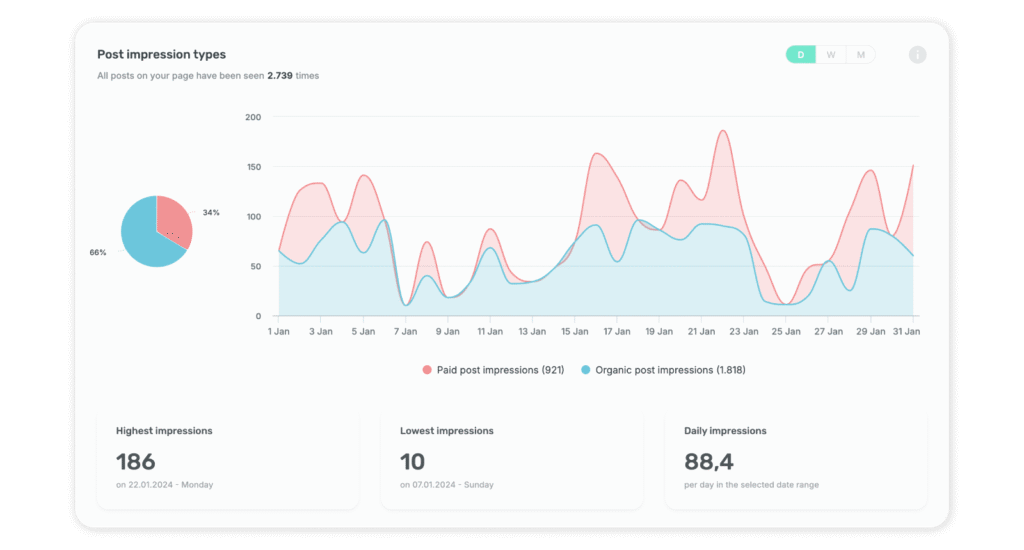
- Paid vs. organic performance — compare results side-by-side to know where budget truly moves the needle.
- Scheduled reports — export branded XLSX, PPT, or PDF reports automatically to your stakeholders’ inboxes.
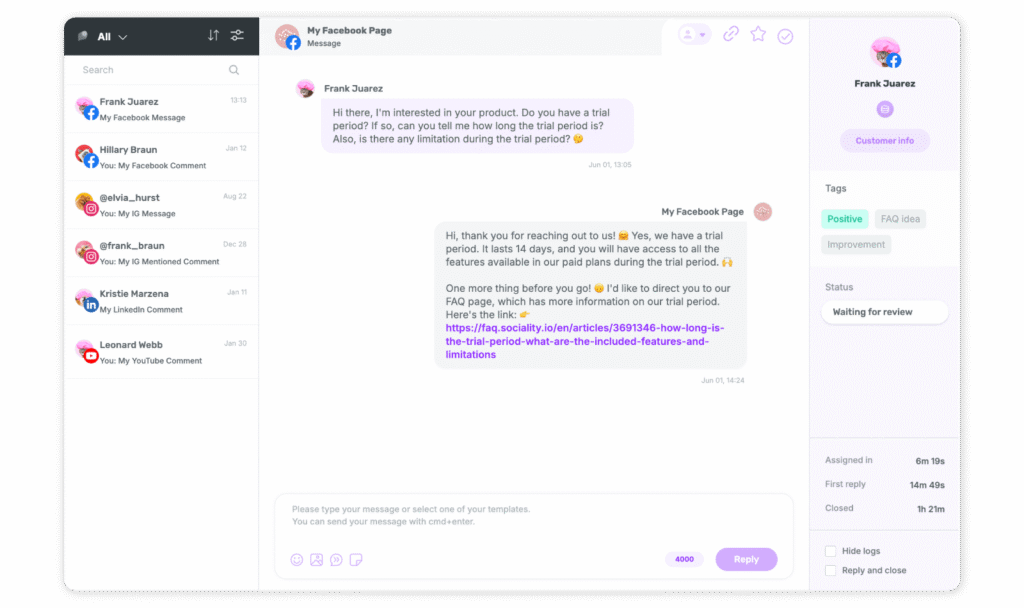
- Unified inbox — reply to hundreds of comments and messages at scale, with AI assist for speed.
- Listening — monitor keywords, competitors, and sentiment in real time to stay ahead of conversations.
- Competitor analysis — benchmark rival Pages, posts, and audience growth to sharpen your strategy.
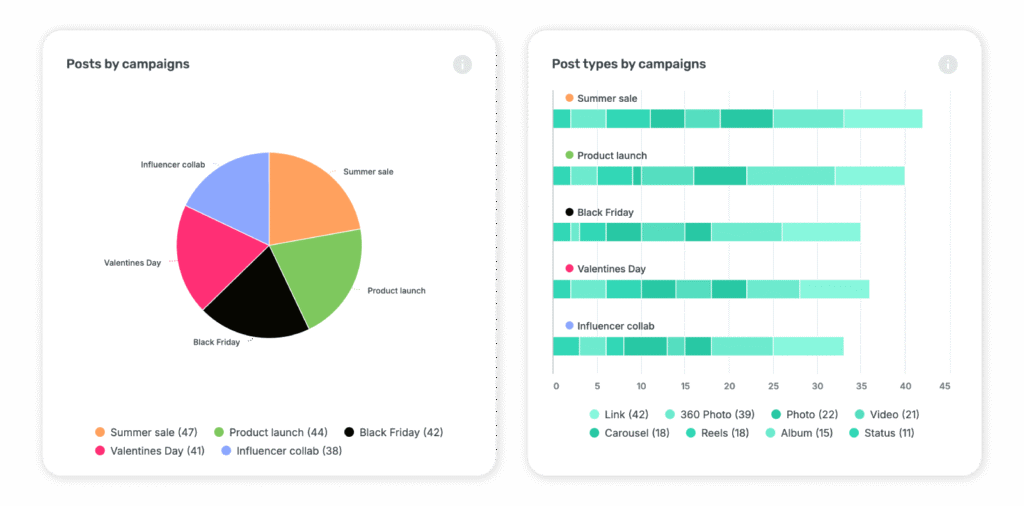
- Campaign intelligence — tag and analyze by campaign (Black Friday, Valentine’s Day, product launches) to see what really drives spikes in performance.
Proof of Sociality.io really works:
- VMLY&R boosted engagement 2.5× in just six months using Sociality.io analytics.
- Havas cut reporting time from a full day to just 15 minutes.
- Rated “High Performer” and “Best Support” in G2’s Summer 2026 report.
👉 Ready to try it? Start your free 14-day trial and see how Sociality.io makes Facebook analytics faster, clearer, and easier to act on.
2026 Facebook analytics updates
In 2026, Facebook analytics is fully integrated into Meta’s current reporting tools rather than a separate dashboard. Businesses now access performance data directly through Meta Business Suite Insights (for organic content and audience metrics) and Ads Manager reporting (for paid campaign performance).
Meta confirms that Business Suite Insights provides Page and Instagram performance data, including reach, engagement, and audience information in a unified view.
(Source: Meta Business Help Center)
For advertisers, Ads Manager supports customizable reports, breakdowns, and performance analysis across placements, demographics, and delivery metrics.
(Source: Meta Business Help Center)
Another noticeable shift is increased automation. Meta’s Advantage+ solutions use machine learning to optimize campaign performance based on your selected objective.
(Source: Meta Business Help Center)
What this means: If you’re checking Facebook analytics in 2026, you’ll find your data inside Business Suite and Ads Manager — with more automation and optimization support built into the reporting workflow.
Mini glossary
| Term | Definition | Where You’ll See It |
|---|---|---|
| Reach | Unique people who saw your content. Different from impressions (which can include repeats). | Professional dashboard, Business Suite → Insights |
| Impressions | Total times your content/ad was shown on screen (can count the same person multiple times). | Professional dashboard, Business Suite, Ads Manager |
| Engagement rate | Interactions (likes, comments, shares, clicks) divided by reach or impressions. | Business Suite → Insights |
| CTR (Click-through rate) | % of people who clicked after seeing your ad/content. | Ads Manager / Ads Reporting |
| CPC (Cost per click) | Average cost you pay for each click. | Ads Manager / Ads Reporting |
| CPA / CPP (Cost per acquisition/result) | Average cost to achieve your goal (lead, purchase, signup, etc.). | Ads Manager / Ads Reporting |
| ROAS (Return on ad spend) | Revenue generated for every $1 spent on ads. | Ads Manager / Ads Reporting |
| Frequency | Average number of times each person saw your ad. | Ads Manager |
| Landing page views | Clicks that actually loaded your page (more reliable than clicks for traffic quality). | Ads Manager |
| Conversion rate | % of visitors who completed the desired action (purchase, lead, etc.). | Ads Manager, GA4 |
| Pixel | Meta’s browser-based tracking code for website events (add-to-cart, purchase). | Events Manager |
| Conversions API (CAPI) | Server-side event tracking sent from your backend to Meta; improves data resilience and attribution. | Events Manager |
| Event match quality | Score showing how accurately events can be matched to users; higher scores = cleaner attribution. | Events Manager → Diagnostics |
| Professional dashboard | Built-in Page view with high-level stats (reach, engagement, followers) for the new Pages experience. | On your Facebook Page |
| Meta Business Suite (Insights) | Free Meta tool for managing Facebook + Instagram; Insights gives combined organic analytics and top content trends. | business.facebook.com or mobile app |
FAQ about Facebook Analytics
Sociality.io (for cross-channel reporting + AI insights), Meta Advantage+ reporting, Sprout Social, Hootsuite Insights, Brandwatch.