


Social media analytics: Channel-by-channel guide to tracking success (2025)
Summarize this article via
When half the world is living on social feeds, social media analytics becomes less of a dashboard and more of a survival kit. 🌍✨
If you’re a marketer in 2025, you can’t just post and pray for likes.
You’ll need to measure, track, and translate those numbers into something sharper—otherwise, you’ll be chasing vanity metrics while your competitors are busy proving ROI.
Let’s take a look at the numbers affecting your social media analytics in 2025:
- There are now 5.41 billion social media user identities globally, equal to nearly 65.7% of the world’s population. (Datareportal)
- People spend about 19 hours a week scrolling through nearly seven platforms.
- Each person spends an average of 0.9 hours per day scrolling, watching, and shopping across platforms, but it’s 1.4 hours for Gen Z, and 1.1 hours for Gen Y. (Deloitte)
- Collectively, that adds up to ~14½ billion hours of social content consumption every single day. (Datareportal)
This guide is here to help you cut through the noise so I’ll unpack these one by one:
- What social media analytics actually means
- How it differs from social listening or intelligence
- Why it’s mission-critical for marketers
- How to turn raw metrics into business results
Because at the end of the day, analytics is about clarity, the opposite of the endless sheets and data chaos.
And clarity is how you’ll defend your budget, win buy-in, and know exactly which story the numbers are trying to tell.
- What is social media analytics?
- How do analytics compare to social listening, data, and intelligence?
- Why is social media analytics critical for marketers?
- How does social media analytics work end-to-end?
- Strategy first: what outcomes are you optimizing for?
- Metrics that matter: What to track and why
- How to use native analytics platform-by-platform
- How algorithm updates change analytics signals
- Competitive & market intelligence: How to benchmark?
- Reports that persuade: Formats, cadence, and stakeholders
- Tools landscape: Choosing the best social media analytics software
- Governance, ethics, and risk
- Wrapping up
Key takeaways (aka TL;DR)
- Focus on KPIs that tie to outcomes—reach, engagement, conversions, sentiment.
- Track platform-specific signals like Reels watch time, TikTok completion, YouTube AVD.
- Compare performance against competitors, industry, and your own history.
- Use a tool like Sociality.io to centralize organic + paid data across channels.
- Review weekly for optimizations, monthly for trends, quarterly for strategy.
- Social media ethics and compliance matter—privacy, consent, and bias aren’t optional.
What is social media analytics?
Social media analytics is the discipline of turning scattered platform signals into clarity and direction.
It starts with gathering data—likes, shares, impressions, video views, clicks—from social channels. But the real aim is in interpretation: understanding what’s working, which levers to pull, and how to course-correct.
According to IBM:
“Social media analytics is the ability to gather and find meaning in data gathered from social channels to support business decisions.”
In practice, analytics is where numbers get a job. You’ll ask questions like:
- Did this campaign bring new eyeballs or just engage followers we already had?
- Which content type (video, carousel, static post) is driving attention?
- How much of our spend is turning into action (CTR, conversions) vs. just views?
Unlike raw social media data (the unfiltered pile of metrics), analytics is about structure, narrative, and action. The data is the canvas—analytics paints the picture.
How do analytics compare to social listening, data, and intelligence?
These terms often get used interchangeably, but they each live in different territory. Let’s look at them one by one:
- Monitoring is the real-time layer. It’s about alerts—mentions, comments, tags—happening right now. Think of it as your brand’s radar.
- Listening zooms out. It tracks recurring conversation themes, sentiment, and keyword trends to understand how people are talking about you, your industry, or your competitors over time.
- Social media analytics is performance-focused. It centers on your own channels, campaigns, and content to measure what works, what doesn’t, and why.
- Social intelligence is the 360° lens you should have. It combines analytics, listening, external research, competitor data, and deeper patterns to inform positioning, strategy, and business moves.
Here’s a handy way to think about it:
| Function | Focus | Core question |
| Monitoring | Mentions, tags, comments | What’s happening now? |
| Listening | Conversations, sentiment, themes | What are people saying, and how is it evolving? |
| Analytics | Performance of content & campaigns | What is working, and what’s next? |
| Intelligence | Strategy, market context | What do all these signals mean for our future? |
🌟When you only monitor or listen, you see noise. When you only do analytics, you risk missing trends in perception. But when you combine them—and layer in intelligence—you get a strategy that’s grounded, informed, and future-facing.
But you should keep that combo running without it turning into a full-time job. You’ll need AI. And according to Sociality.io’s 2026 AI in SMM statistics based on research, 59.5% of marketers say they already been using AI for analytics and reporting.
Also, collecting numbers is the easy part today, turning them into a clear “so what?” fast enough to act on. Luckily, in 2026, you can chat with your analytics in Sociality.io. Stay tuned!
Why is social media analytics critical for marketers?
Social media has turned into the daily newsstand, the town square, and the shopping mall all at once. People spend close to 19 hours every week on feeds, jumping between nearly seven different platforms a month. That’s a huge share of attention—but also a fragmented one.
For marketers, this creates both an opportunity and a problem. You’re meeting your audience where they already are, but you’re also fighting for space in an endless scroll. Social media analytics is what helps you figure out if your content is cutting through, or if it’s just adding to the noise.
Proving ROI and defending budgets
Budgets don’t defend themselves. In 2025, every marketing dollar has to earn its place on the balance sheet. Social media analytics gives you the receipts: conversions tied back to campaigns, return on ad spend, and engagement rates that connect directly to business growth.
Marketing leaders who align analytics with business impact are almost twice as likely to report year-over-year revenue growth. That kind of proof is what turns “nice-to-have” campaigns into repeat investments.
Setting and tracking business goals
Without analytics, goals can slip into guesswork. But when you’re looking at reach, clicks, or conversions through the lens of business priorities, the numbers start to tell you if you’re actually moving in the right direction.
For example:
- If awareness is the goal, you’ll measure reach, impressions, and share of voice.
- If acquisition is the goal, click-through rates and conversion rates take the spotlight.
- If retention matters most, you’ll be tracking repeat engagement, loyalty signals, and advocacy.
As a study published in Journal of Retailing and Consumer Services, companies aligning marketing analytics with strategic objectives see higher ROI and more resilient growth—even when market conditions change.
Spotting trends and managing brand sentiment
Feeds move faster than press cycles. A format can rise in a week, and sentiment can flip in a single post. Analytics is how you notice the shift before it becomes a blind spot.
Maybe short-form video is suddenly outperforming static posts, or maybe brand mentions spike because of a viral conversation you didn’t plan for. Tracking engagement, sentiment, and share of voice tells you not just what happened, but where to adjust in real time.
We Are Social notes that 97% of internet users worldwide use social media at least once a month in 2025. That’s essentially the entire online world watching and reacting. Without analytics, you’d never know when the story about your brand starts to change.
How does social media analytics work end-to-end?
Analytics may look like a clean dashboard on the surface, but behind it is a chain of steps that turn raw activity into insight. Knowing this flow matters, because if one link breaks—say your data isn’t cleaned or your reporting skips context—you’ll end up with numbers that look neat but don’t mean much.
Think of it as a cycle: collect → prepare → analyze → share → act. Then repeat.
Data collection
It all begins with pulling information directly from the platforms: impressions, reach, clicks, follower growth, watch time, and sentiment. APIs and native tools feed this raw data into your analytics system. Without this step, everything else falls apart.
Data cleaning and normalization
Raw data is messy. Different platforms use different names for similar metrics (reach vs. impressions, views vs. plays). Cleaning and normalization make the numbers consistent so they can be compared side by side. This step is less glamorous but it’s what makes a multi-platform report possible.
Analysis and visualization
You might notice that video completion rates spike on certain days, or that engagement lags behind impressions on a campaign that looked successful at first glance. Visualization—charts, graphs, trendlines—helps translate these findings into something stakeholders can grasp quickly.
Reporting insights to stakeholders
Analytics loses its value if it stays locked in spreadsheets. Reporting distills the signal into a story: what happened, why it matters, and what should happen next. The format shifts depending on your audience—weekly summaries for the marketing team, quarterly rollups for leadership, deeper dives for clients.
Acting on data and iterating
The final step is the one that closes the loop. Insights are only powerful if they change behavior—whether that means testing new hooks, reallocating ad spend, or shifting posting times. And because platforms and audiences never stop changing, iteration keeps the cycle alive.
Strategy first: what outcomes are you optimizing for?
Analytics is only useful when it’s tied to a goal. Too often, teams collect dozens of metrics but can’t explain what they actually mean for the business. The smarter move is to start with outcomes—awareness, engagement, conversion, or loyalty—and then decide which signals to track.
Translating business objectives into KPIs
Every organization has broad objectives, but analytics makes them measurable. If your goal is brand awareness, you’ll anchor your social media KPIs in reach, impressions, and share of voice. If customer acquisition is the priority, then conversion rates, lead volume, and attribution paths become the benchmarks.
The important part is consistency: once a KPI is tied to an objective, it’s how you’ll judge success or failure. Without that link, metrics risk slipping into vanity territory.
Benchmarks: competitor, industry, and historical
Numbers don’t mean much in isolation. A 3% engagement rate can look great until you see that your top competitor averages 5%. So, benchmarks give context, whether they come from industry studies, direct competitor analysis, or your own historical data.
Looking back at previous campaigns is just as valuable as looking sideways at competitors. A year-over-year lift in video completion rate, even if the number looks small on its own, might signal that your creative strategy is moving in the right direction.
How often should you check analytics?
Not every number needs a daily refresh. Some metrics move slowly, and watching them every morning won’t change your decision-making. Others shift quickly and demand frequent attention.
A practical cadence is this:
- Weekly for campaign health checks and quick optimizations.
- Monthly for reporting progress against goals.
- Quarterly for strategy reviews, when leadership wants to see patterns and bigger shifts.
The key is rhythm—often enough to act on changes, but not so often that you drown in updates.
Metrics that matter: What to track and why
Social media analytics gives you access to hundreds of numbers. But not all of them deserve your attention. Some are leading indicators of growth, others are business-critical KPIs, and a handful are just noise. The trick is separating the signals that move strategy from the vanity metrics that only look good in a screenshot.
Harvard Business Review points out that many executives still focus too heavily on vanity numbers instead of tracking performance indicators that connect directly to business outcomes. The goal is to choose the metrics that tell you whether social is helping you achieve awareness, acquisition, or revenue—not just whether a post “looked good.”
Awareness metrics (reach, impressions, follower growth)
Awareness tells you how many people are seeing your brand and whether that visibility is growing. Reach reflects the unique audience, impressions capture total exposures, and follower growth measures momentum over time.
These are the metrics that sit at the top of the funnel, helping you answer: Are enough new eyes discovering us?
DataReportal reports that the average social media user now visits nearly seven different platforms per month, making multi-channel reach more important than ever.
Engagement metrics (likes, comments, saves, CTR, video views)
Engagement reveals how your audience responds once they’ve seen your content. Likes, comments, and shares show interaction, but saves often signal higher intent. CTR (click-through rate) connects engagement to measurable action, while video metrics—views, average watch time, completion rate—reflect whether your creative holds attention.
MarTech emphasizes that engagement metrics shouldn’t be dismissed as “soft.” They are critical markers of whether content nurtures leads along the customer journey.
⚠️ There’s one major pitfall you should be aware of: Instagram’s API only reports organic likes and comments to third-party tools andif you boost posts, most analytics platforms (including Sprout Social, Agorapulse, and Hootsuite) only show the organic interactions. That means reports undercount the true impact of campaigns—creating confusion at the executive level when results look weaker than reality. Luckily, you have Sociality.io. ✨ Unlike the competitors, Sociality.io combines both organic and paid interactions in its reporting. That means agencies and in-house teams get the full picture of how campaigns are performing—without misleading data!
Conversion metrics (UTMs, attribution, revenue)
Conversion metrics connect social to business outcomes. UTMs help identify which platforms and campaigns are driving traffic and leads. Attribution models (first-click, last-click, multi-touch) reveal how social contributes along the path to purchase. And revenue metrics—average order value, cost per conversion, return on ad spend—bring the performance back to dollars.
Customer care metrics (response times, CSAT)
Social channels double as customer service desks. Tracking response time, resolution rate, and CSAT (customer satisfaction) shows how well you’re supporting your community. These metrics are particularly valuable for retention, because customer experience plays a direct role in repeat business.
Brand metrics (share of voice, sentiment, emotion)
Brand metrics zoom out to the competitive context. Share of voice shows how much space your brand occupies compared to competitors, while sentiment and emotion analysis reveal how people feel when they mention you. These are essential for understanding reputation and market positioning over time.
Paid vs. organic performance reporting
Organic activity builds relationships over time, while paid campaigns deliver quick reach and scale. Tracking them together is essential. Comparing CPM (Cost per mille), CPC (Cost per click), and ROAS (Return on ad spend) alongside organic engagement shows whether your creative stands strong on its own or only gains traction with a budget behind it.
Funnel-aligned social metrics
| Funnel stage | KPI / North Star | Primary metric | Diagnostic metrics | Reporting cadence |
| Awareness | Reach / Share of Voice | Impressions | CPM, frequency, content type | Weekly |
| Engagement | Engagement rate | Shares, saves, comments | Hook rate, watch time | Weekly |
| Consideration | Traffic quality | CTR, bounce rate | UTM source, time on page | Weekly |
| Conversion | Leads / Revenue | CVR, AOV | Assisted conversions, path length | Monthly |
| Retention/Advocacy | Loyalty | Repeat purchase, referrals | NPS, sentiment tracking | Monthly |
How to use native analytics platform-by-platform
Every platform speaks a slightly different analytics language. Some focus on reach, others on watch time, and a few still highlight vanity metrics that don’t tell you much. If you want to build reliable reports, you’ll need to know not just where to click but also which social media metrics actually matter.
Instagram analytics
Instagram analytics are available to business and creator accounts inside the app under Professional Dashboard → Insights. As of 2025, Meta has standardized everything into views as the baseline metric.
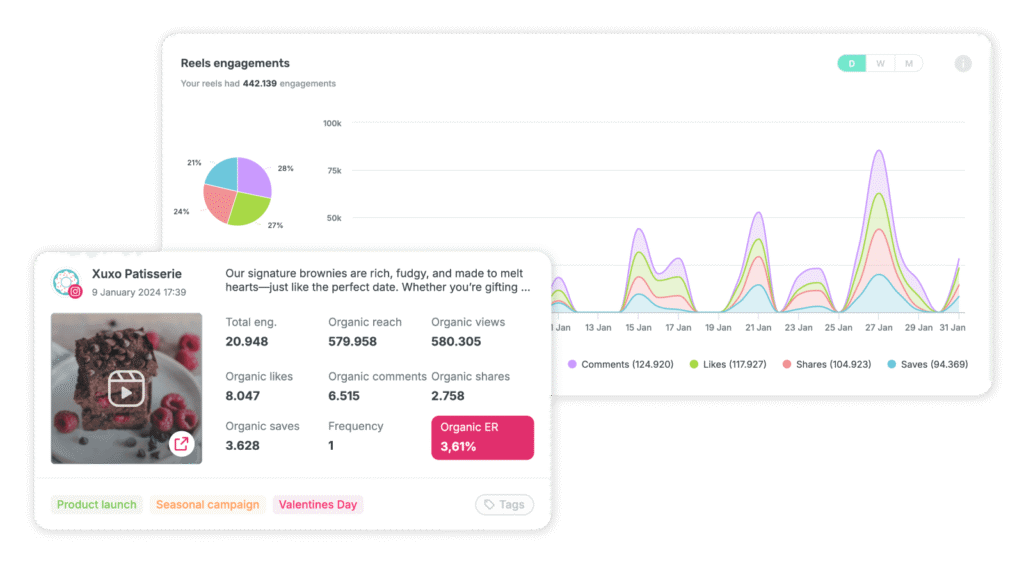
What really matters now is Reels watch time and saves. Reels generate more than 70% of all Instagram views, making watch time a key indicator of whether people stay with your content.
Saves, on the other hand, reveal long-term value—content that audiences want to keep, revisit, or share. Together, these metrics separate quick reactions from posts that actually influence behavior.
Stories tell another side of the truth. Completion rate shows if your pacing keeps people tapping forward or if they exit too soon, while taps and replies help you understand whether Stories are driving actual interaction. For carousels, saves and shares are stronger signals than likes, since they point to educational or useful content that lives beyond the initial post.
With Sociality.io, you move past Instagram’s 90-day limit and see clear, detailed analytics for Reels, Stories, and posts in one dashboard—making reporting faster and far more reliable.
TikTok analytics
TikTok analytics are available in TikTok Studio (Creator Tools → Analytics) for creators and in Business Suite → Analytics for business accounts.
he dashboards cover everything from account growth to post-level performance, but some metrics matter more than others.
In 2025, completion rate has become one of the most critical social media KPIs on TikTok. The algorithm doesn’t just reward views—it prioritizes videos that people actually finish. A strong completion rate signals that your hook, pacing, and content structure kept attention all the way through, increasing the chance of wider distribution.
BONUS: How to increase your completion rate 👀👇
Alongside that, watch time and average view duration help you spot exactly where viewers drop off.
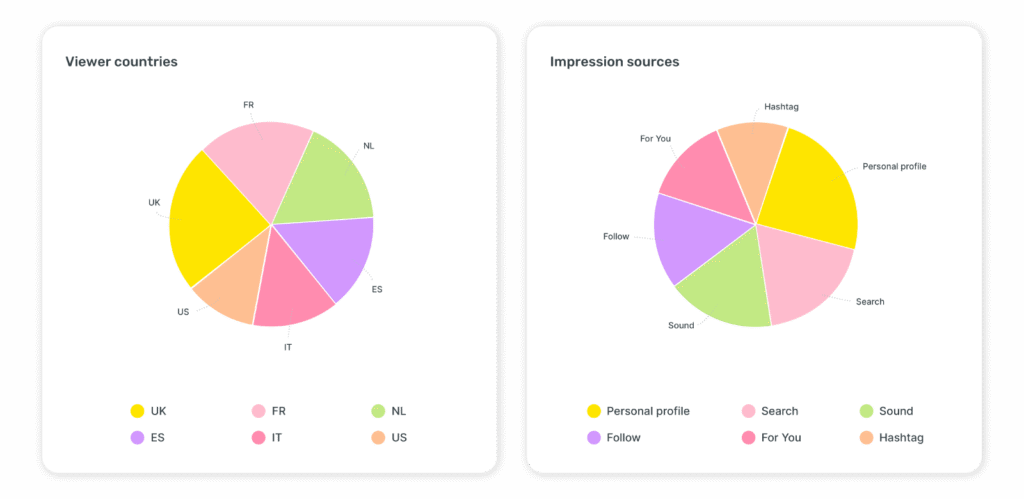
Traffic sources are another insight worth watching. TikTok shows whether views came from the For You feed, Following, Search, Sounds, or Profile. Knowing where attention originates helps you double down on discovery tactics that are already working.
While TikTok’s built-in analytics provide a solid start, they’re limited in scope and history. Sociality.io makes analysis faster and clearer with clean graphs that highlight watch time, retention curves, viewer countries, and impression sources—insights many tools skip. That means you can track what’s working at a glance and compare TikTok’s performance side by side with your other channels.
Facebook analytics
The standalone Facebook analytics app was retired in 2021, but performance data lives on inside Meta Business Suite → Insights.
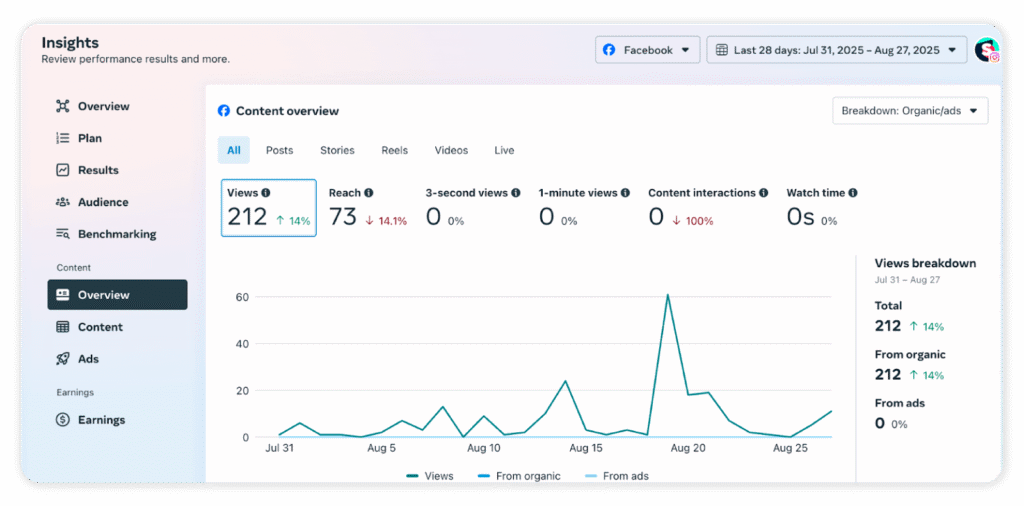
What matters now is not how many people liked your post, but how many engaged relative to the reach. Engagement rate per post has become the clearer signal of whether your content holds its own without paid support.
With organic reach shrinking year after year, tracking this metric week over week helps you see which formats are still worth your creative energy—whether that’s short-form video, carousels, or community-driven posts that spark comments and shares.
LinkedIn analytics
LinkedIn provides company page analytics under Admin View → Analytics, and post-level stats for individual creators.
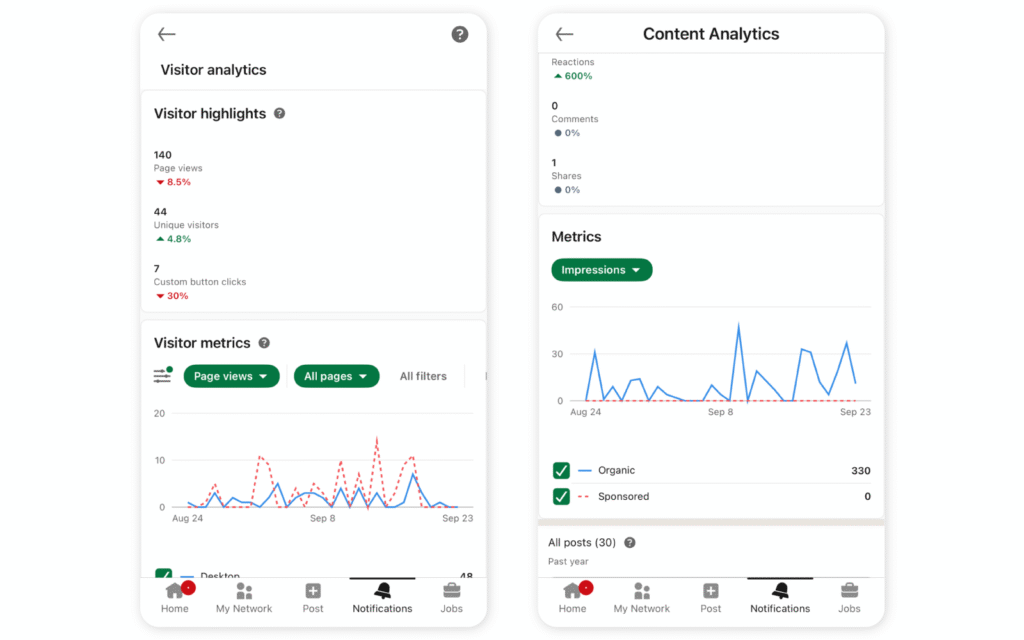
For most B2B marketers, the north star metric of LinkedIn analytics is new followers from posts, since follower growth signals whether your content is breaking into new professional circles instead of just recycling the same audience. But follower growth isn’t the only story.
Page views give you an important measure of curiosity—are people clicking through to learn more about your brand after seeing your content?
Post-level engagement rate reveals whether updates are actually sparking interaction, while CTR shows if thought-leadership content and campaign posts are driving traffic to landing pages or sign-ups.
LinkedIn analytics also surface demographic insights—by job title, seniority, or industry—which makes them especially powerful for lead generation and employer branding. And since organic reach on LinkedIn is competitive, tracking saves and shares is a strong indicator that your content is delivering long-term value rather than being scrolled past.
While LinkedIn’s native analytics are useful, many teams need a broader view that goes beyond the platform’s 12-month limits. This is where Sociality.io becomes valuable: You can analyze LinkedIn side by side with other channels, compare paid and organic performance, and generate ready-to-share reports for leadership without juggling spreadsheets.
X / Twitter analytics
X/Twitter analytics are found under More → Analytics on desktop. Key metrics include impressions, engagement rate, and profile visits.
Impressions show how often your tweets appeared, but the north star metric is engagement rate—it signals whether your content breaks through the noise and earns interaction. Profile visits are another strong indicator, showing when posts drive curiosity and potential new followers. And if you’re running campaigns, CTR tells you whether tweets are moving people beyond the platform.
Today, we're rolling out a new and improved analytics page. Upgrade to Premium to get daily insights into how your posts are performing.https://t.co/ZVdEbG1PJa pic.twitter.com/5qmklLcsOC
— Premium (@premium) June 13, 2024
YouTube analytics
YouTube Studio remains one of the richest analytics dashboards, giving you reach, engagement, audience demographics, and even revenue insights. But one metric stands above the rest: average view duration (AVD).
YouTube’s algorithm rewards videos that hold attention, so if viewers stick around, your content gets recommended more often. Pair AVD with click-through rate (CTR) on thumbnails and titles, and you’ll know not only if people click, but whether they actually stay. That combination is the heartbeat of YouTube analytics and growth. Sociality.io makes it easier to pull these stats into cross-channel reports, so YouTube doesn’t sit in its own silo.
Pinterest analytics
Pinterest analytics live in Analytics → Overview for business accounts (Pinterest Help).
Unlike other platforms, Pinterest isn’t about fleeting likes—it’s about saves. A save means your pin inspired someone enough to keep it, often as part of a shopping list or project board. In other words, it’s an early intent signal.
Pair saves with outbound click data, and you can see not just interest, but actual movement toward a site or product page.
Snapchat insights
Snapchat Insights, available through Ads Manager or under Profile → Insights, give brands a closer look at audience interaction.
The most telling metric is story completion rate. If users consistently watch through to the end, your storytelling is working; if they drop early, the narrative isn’t landing. For campaigns, pairing completion rate with swipe-up clicks tells you whether your Stories not only entertain but also drive action.
Threads & Reddit
Threads currently offers only basic post-level numbers: Likes, replies, and reposts. For now, this makes it more of a qualitative channel—tracking conversation flow rather than deep metrics.
Over time, expect integration into Meta’s Business Suite, which should unlock richer analytics. Reddit, by contrast, offers deeper reporting inside Reddit Ads Manager.
Metrics here lean on impressions, clicks, and community engagement, but the real value is in comment depth and upvote ratio, which reveal whether people are truly engaging with the discussion. Sociality.io tracks both platforms where possible, giving brands a way to measure participation across emerging spaces without switching between dashboards.
How algorithm updates change analytics signals
Algorithms keep changing the rules. Instagram’s priority on original content reduces reach for repost-heavy accounts. TikTok still rewards completion and watch time. YouTube is doubling down on retention. And on X, engagement rate continues to outweigh impressions.
This means that if you’re building a social tracker across platforms, you can’t just copy-paste KPIs. You’ll need to track the native signals that matter most today and stay ready for them to shift again tomorrow.
Native analytics roadmap in 5 seconds
| Platform | Analytics entry point | North star metric |
| Professional Dashboard → Insights | Reels watch time / saves | |
| TikTok | Creator Tools → Analytics (TikTok Studio) | Completion rate |
| YouTube | YouTube Studio → Analytics | Avg. view duration (AVD) |
| Admin View → Analytics | New followers from posts | |
| X/Twitter | More → Analytics (desktop) | Engagement rate |
| Meta Business Suite → Insights | Engagement rate per post | |
| Analytics → Overview | Saves | |
| Snapchat | Profile → Insights / Ads Manager | Story view completion |
| Threads | Native post-level stats | Comment/reply depth |
| Reddit Ads Manager → Analytics | Community engagement depth |
Competitive & market intelligence: How to benchmark and watch the field
Looking only at your own numbers is like playing tennis against a wall—you’ll improve your swing, but you’ll never know how it holds up in a real match.
Competitive benchmarking shows you where you stand in the market, which gaps to close, and which opportunities others are ignoring.
What is social media competitor analysis?
Competitor analysis means tracking how rival brands use social, which formats earn them attention, and how often they post. It’s not about copying—it’s about understanding the standards in your niche so you know what “good” really looks like.
Marketers often use a social media stat tracker or a custom dashboard to line up their numbers against the competition. This helps answer questions like: Are we posting often enough? Is our engagement rate above or below the industry average? Are we winning share of voice in conversations that matter?
How to compute fair benchmarks
Not all benchmarks are created equal. A 2% engagement rate on Instagram means something very different for a brand with 5,000 followers than it does for one with 5 million. Fair benchmarking means grouping competitors by size, industry, or region so comparisons stay relevant.
If you’re wondering how to track social media analytics for benchmarking, the most common approach is threefold:
- Track your historical performance (year-over-year, quarter-over-quarter).
- Line up peer competitors using public metrics and available tools.
- Overlay industry averages from reports by Statista, Pew Research, or DataReportal for the global context.
Using share of voice and topic clusters
Share of voice is one of the most revealing competitive metrics and it measures what portion of the conversation your brand owns compared to others in your category. Tracking it over time shows whether your campaigns are gaining ground or getting drowned out.
Paired with topic clusters, share of voice can uncover content whitespace. For example, you might find competitors dominate conversations about discounts, but nobody is leading thought leadership discussions. That gap can become your opening.
Competitor benchmarking setup
| Competitor | Channels tracked | Posting frequency | Avg. engagement rate | Top content type | Notes |
| Competitor A | Instagram, LinkedIn | 3x/week | 2.1% | Video explainers | Steady growth |
| Competitor B | TikTok, YouTube | Daily | 6.5% | Short-form video | Heavy paid support |
Reports that persuade: Formats, cadence, and stakeholders
A social media analytics report isn’t just a pile of charts—it’s a story about performance, choices, and next steps. The way you package insights will decide whether leaders see them as background noise or as evidence worth acting on.
The most persuasive reports connect social media metrics to business outcomes and are tailored to the audience. A weekly snapshot keeps practitioners on track, while a quarterly review gives executives a clear view of whether social is actually fueling growth.
What does go into a report?
At a minimum, a strong report should cover:
- KPIs tied directly to objectives (reach, engagement rate, conversions, retention).
- A view of trends over time, not just the last campaign.
- Top- and bottom-performing posts with diagnostic metrics (watch time, CTR, sentiment).
- Recommendations for what to test or change next.
Learning how to understand social media analytics is about moving from raw data to action. Instead of saying “engagement dropped,” the report explains, “non-follower reach declined by 20% because posting times didn’t align with peak activity—next week we’ll test earlier slots.”
Weekly vs. monthly vs. quarterly cadence
Different rhythms serve different needs:
- Weekly reports are tactical. They help social teams adjust campaigns in real time.
- Monthly reports zoom out and connect performance to business KPIs, highlighting whether awareness, engagement, or conversions are on track.
- Quarterly reports are strategic. They look at broader shifts, competitive context, and whether the overall social strategy supports business goals.
How to visualize performance for executives?
Executives don’t need (or want) to see every metric. They want a digestible view of ROI and risks. Visual dashboards—sparklines, heatmaps, clear bar charts—turn metrics into an easy narrative. The focus should stay on business impact, not vanity numbers.
Automating reports without losing narrative
Automation can save hours, but it doesn’t replace interpretation. Scheduling exports and templates is efficient, but you still need the context that explains what the numbers mean. Without that layer, you’re just tracking social media metrics without a story.
Tools landscape: Choosing the best social media analytics software
Native analytics will only take you so far. If you’re managing multiple platforms, need longer data history, or want competitor benchmarks, you’ll end up looking at third-party solutions. The question is: which one is worth the investment?
Must #1: Accurate analytics
Competitors also fall short in metrics accuracy: as mentioned, Sprout Social, Agorapulse, and Hootsuite can only show organic Instagram interactions, leaving boosted posts undercounted. This gap leads to misaligned reporting and unnecessary tension with clients or executives.
Sociality.io solves this pain point by displaying total interactions (organic + paid), so teams can confidently show results without spending hours reconciling missing numbers.
There’s also an upcoming AI for social media analytics feature; it’ll allow you to simply chat with your analytics.
Must #2: Fair pricing
This is where users often face frustration :
😫Sprout Social and Agorapulse have moved to seat-based pricing. For larger teams, this can send budgets through the roof—even when they only manage a handful of accounts. Enterprises end up paying for “seats” rather than the value they actually use.
😫Hootsuite and Sprinklr apply unexpected yearly price hikes, locking users into contracts that climb each year. Many long-time customers are now rethinking whether these social media analytics tools justify the cost.
🩵By contrast, Sociality.io offers a pricing model designed to stay predictable and fair. Instead of punishing teams for growing or for adding more users, Sociality.io keeps pricing clear and scalable—making it a better fit for agencies and enterprises that need to plan long-term.
Must #3: Deep video analytics
Some leading tools still don’t include TikTok or Instagram’s newer video metrics—like average watch time and total play time. These are essential for brands running video-heavy strategies. Without them, social media analytics reports miss the real driver of retention.
Sociality.io covers these in depth, ensuring media companies and brands don’t lose visibility on their most important content.
Must #4: Flexible reporting
Agencies often export data into Google Spreadsheets or Looker to build custom client reports. Many tools make this process clunky or don’t offer direct integrations.
Sociality.io supports Google Spreadsheet integration, making it easy for agencies to create custom dashboards or polished reports without copy-pasting data.
“Before using Sociality.io, I would spend a whole day preparing a detailed report. Now with Sociality.io, it takes me 15 minutes tops.” Sena Arısoy, Engage Istanbul
Must #4: Customer support
Finally, customer support. It’s not often discussed in marketing blogs, but in practice it can make or break deadlines. Agencies under pressure can’t afford to wait days for a response.
This is another area where Sociality.io wins loyalty. While competitors like Sprinklr often receive feedback about slow or rigid support processes, Sociality.io’s customer success team is consistently praised for fast, reliable, and human help.
Governance, ethics, and risk
The power of social media analytics comes with responsibility. When you’re collecting billions of interactions and making decisions off them, the way you handle data matters just as much as the insights you extract.
Privacy, consent, and bias pitfalls
Social data isn’t neutral. It’s built on user behavior, and that behavior is shaped by culture, algorithms, and even unconscious bias in the way people comment or share. If analytics are used without context, they can reinforce stereotypes or lead brands in the wrong direction.
There’s also the matter of privacy. Platforms set clear rules on what can and can’t be collected, and third-party tools are bound by APIs. Stretching beyond those boundaries—say, scraping private groups or ignoring consent—might bring short-term wins, but it carries long-term risks for both compliance and brand trust.
Data retention and compliance
Every analytics workflow should answer two questions: How long do we keep this data, and who gets access to it? Regulations like GDPR and CCPA don’t just apply to customer records; they extend to digital behavior and engagement data, too.
It’s smart practice to:
- Retain only what you actually use for analysis.
- Set expiry policies for raw data exports.
- Control permissions so that only those who need sensitive insights (like sentiment or demographic data) can access them.
FAQs about social media analytics
Wrapping up
By now, you’ve seen that social media analytics is the difference between chasing vanity metrics and building a strategy that proves ROI, secures budgets, and grows brands.
Here’s your quick takeaway before waving goodbyes:
📊 Focus on the right KPIs, not every number—reach, engagement, conversions, and sentiment will carry you further than likes alone.
⚡ Native dashboards are useful, but they’re not enough for multi-channel, multi-account teams.
🩵A social media analytics tool like Sociality.io saves time, gives you the full picture (organic + paid), and helps you tell the real story behind the numbers.
🌟Weekly checks keep campaigns sharp, monthly reports show trends, and quarterly reviews shape long-term strategy.