
X/Twitter analytics shows how your posts and your account perform on X: impressions, engagements, profile visits, new follows and video views. Analytics for your own posts is still free, but the full account dashboard now needs a paid X subscription.
Analytics makes the difference between assumptions and decisions. By tracking performance, you can:
- Identify what drives engagement
- Monitor growth patterns across campaigns
- Connect activity on X to conversions and revenue
Key takeaways
-
The account dashboard is paid: full account analytics needs an X Subscription plan, and Plus costs $8 a month or $80 a year. Analytics for your own posts stays free.
-
Some metrics are owner-only: link clicks and profile visits are non-public metrics that only the account owner can see, and through the X API they are available only for posts from the last 30 days.
-
Impressions aren’t people: X counts views from logged-in accounts, including the author’s own and repeat views, so treat impressions as exposure, not unique reach.
-
Size the audience correctly: X’s potential ad reach was 450 million in April 2026, down from 611 million two years earlier. That is ad reach, not monthly active users.
-
AI is increasingly used to speed up X reporting: 59.5% of marketers use AI for analytics and reporting (Sociality.io survey, 2026).
What is X/Twitter analytics? Why do Twitter insights matter for marketers?
X/Twitter analytics is the set of reports X gives account owners about how their posts, followers and videos perform. X, aka Twitter, changes quickly. What performs today could sink tomorrow, and analytics is the only way you can see what’s actually happening and turn activity into evidence you can act on.
Growth you can prove
Your reach and momentum shouldn’t be based on guesses. Analytics lets you track how far your posts travel and whether campaigns gain traction. If you see a spike, you’ll know what caused it.
Creative you can iterate
Hooks, captions, and visuals might feel strong, but the data will show which ones land. If threads keep pulling higher engagement than single posts, you can double down with confidence.
Revenue you can attribute
Clicks and conversions can be traced to specific posts or ads, as long as you tag your links and set up conversion tracking. That’s what turns a good month on X into a number your finance team will accept.
Customers you can hear
Mentions and replies may look like casual comments, but they often reveal pain points, ideas, or service gaps. By listening to these signals, you can shape your roadmap around what people actually need.
How to see X/Twitter analytics in 2026: step-by-step guide
X has two places for analytics. The account dashboard on desktop covers your whole account and needs a paid plan, while post analytics covers one post at a time and is free on your own posts. If you’re managing a brand account, you might need to check both, depending on the depth of reporting you want.
Desktop: the account dashboard (Plus and above)
What you get: Overview charts (impressions, engagements, profile visits, follows), plus Audience, Content and Video tabs, and tabs for Spaces and Live.
Where it lives: x.com/i/account_analytics, gated by an X Subscription plan.
Steps
- Sign in to x.com on desktop.
- Go to x.com/i/account_analytics. The old analytics.twitter.com address no longer opens the dashboard, so update any bookmarks.
- Pick a date range. The Overview runs from the last 7 days up to a year.
- Drill down into Content, Audience or Video.
- (Optional) Export a CSV from Overview, Content or Video for deeper analysis in Sheets or Excel.
X rolled out its improved analytics page for paying subscribers in June 2024, and the full dashboard has sat behind a subscription ever since. When we opened account analytics on a free account in November 2026, X showed an “Advanced analytics with Plus” upgrade screen instead of the data.
Post analytics: free on your own posts
What you get: Analytics for an individual post: impressions, engagements, detail expands, profile visits and link clicks, plus likes, reposts and replies.
Where it lives: Under each of your posts, on the web and in the app.
Steps
- Open one of your own posts on x.com or in the X app.
- Click or tap the bar chart icon (the view count) under the post.
- Review the Post analytics panel.
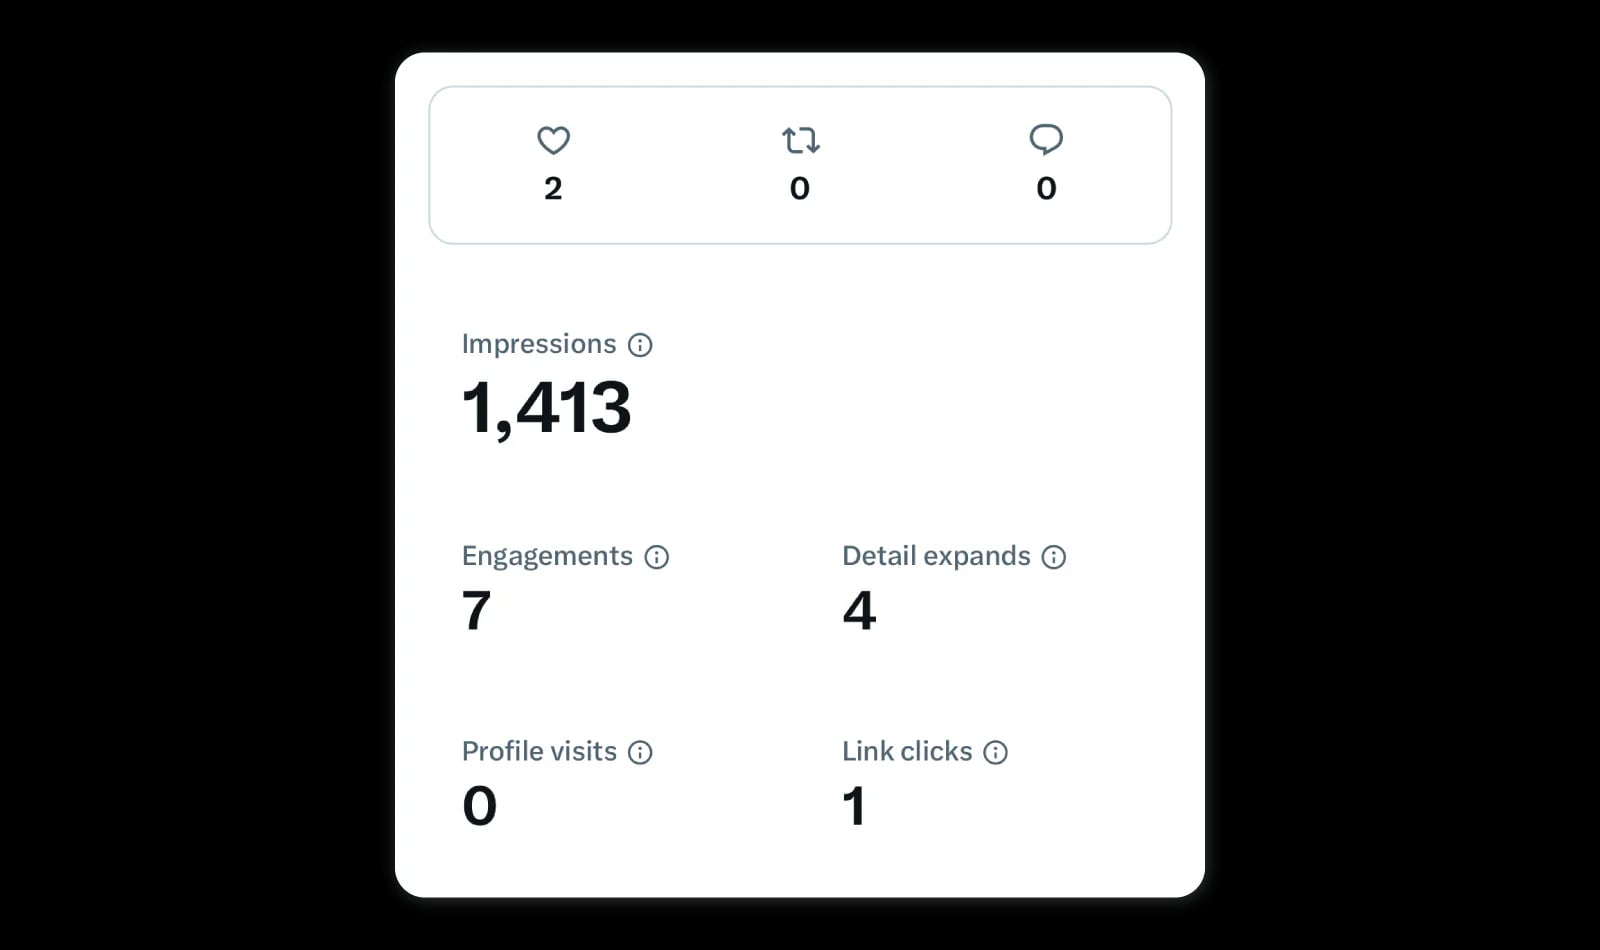
Anyone can see the view count, likes and reposts on a public post. The breakdown in this panel (detail expands, profile visits, link clicks) is visible only to you.
| Access | Path | Paid plan needed | Scope | Export |
|---|---|---|---|---|
| Account dashboard | x.com/i/account_analytics on desktop | Yes (Plus or higher) | Overview, Audience, Content, Video | CSV on desktop |
| Post analytics | Your post → bar chart icon | No | One post | No native export |
| Public counts | Any public post | No | Views, likes, reposts, replies | No |
Which X plan includes analytics?
Since October 2026, X sells new subscriptions under one name, the X Subscription, with five plans. X’s upgrade screen points free accounts to Plus for advanced analytics, and every plan above Plus includes the full benefits of the old Premium+.
| Plan | Price (monthly) | Analytics |
|---|---|---|
| Free | $0 | Post analytics on your own posts |
| Plus | $8 ($80 a year) | Account dashboard |
| Premium, Super, Ultra | $30, $100, $200 | Account dashboard, plus the old Premium+ benefits |
If you already pay for a legacy Premium or Premium+ plan, it carries on. Switching to one of the new plans cancels and refunds the old subscription, so check what you’d gain first.
Does paying for X increase your reach? X says subscribers get their replies prioritised, but it doesn’t promise more impressions on every post, so compare like-for-like posts before and after you subscribe rather than trusting the badge.
Why is X analytics not working?
Most “X analytics not working” problems come down to one of four things:
- You see an upgrade screen. That’s the plan gate, not a bug. Your account needs Plus or a higher plan (or a legacy Premium subscription).
- An old bookmark. analytics.twitter.com and older Tweet activity links don’t lead to the current dashboard. Go to x.com/i/account_analytics.
- The page won’t load. X’s troubleshooting advice is to check your connection or VPN, try a private window or another browser, and clear the cache and cookies or switch off extensions.
- Numbers don’t match your website. A link click on X isn’t a website session, because some people leave before the page finishes loading.
What does the X analytics dashboard include?
The current dashboard opens on Overview, a snapshot of impressions, engagements, profile visits, new follows and your posting activity over the period you pick. From there, the Content, Audience and Video tabs go deeper, with Spaces and Live tabs alongside. Campaign and conversion reporting sits separately, in X Ads.
You may still see older names in guides and help pages: the Post activity dashboard (PAD) and Video activity dashboard (VAD) belong to the earlier analytics site and to X Ads, and Media Studio has its own video reports.
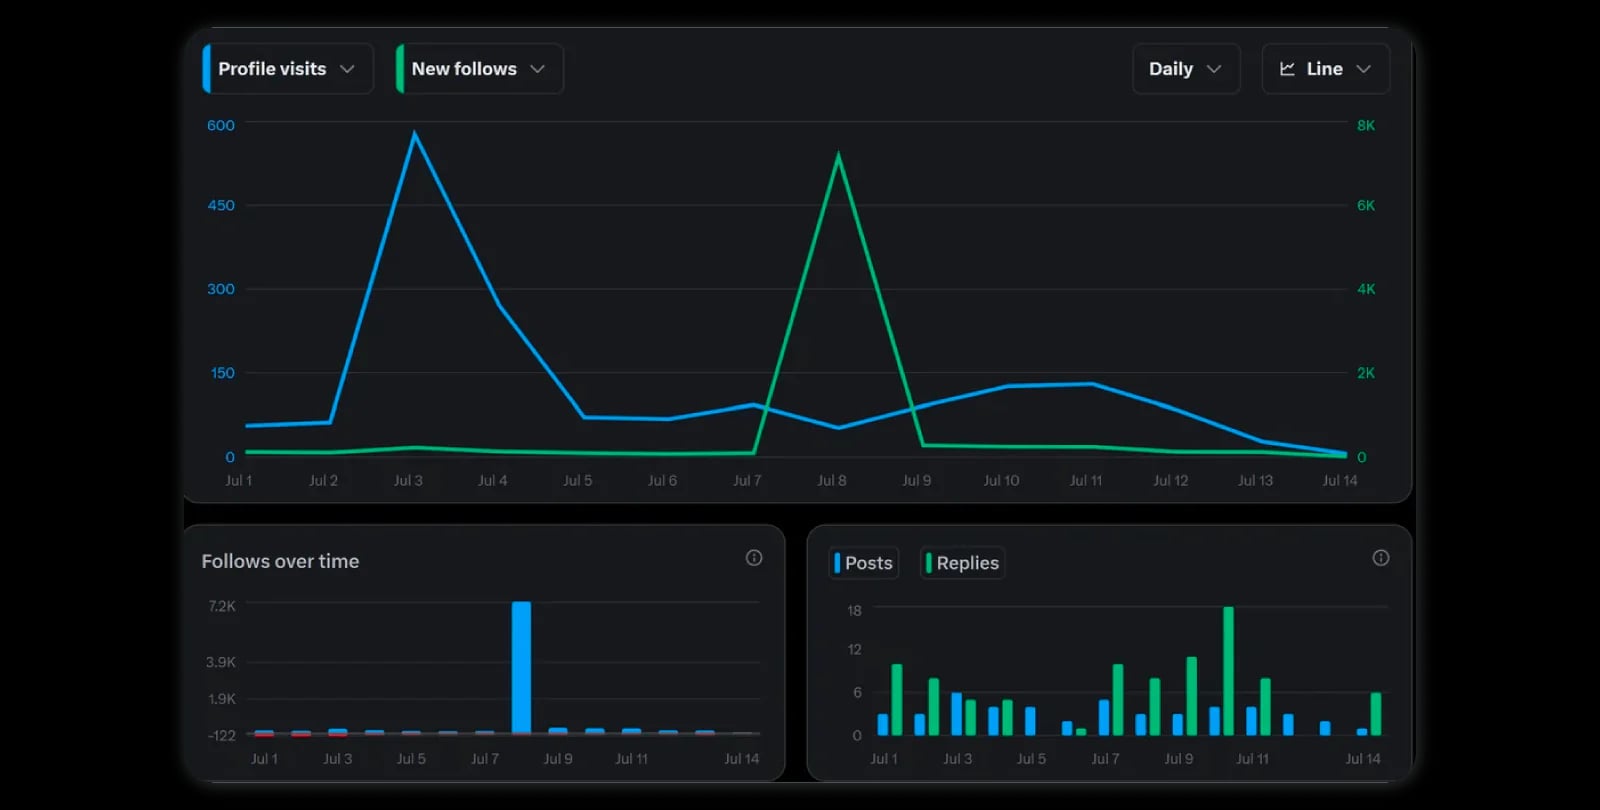
Content tab (formerly the post activity dashboard)
This view goes deeper into each post. You’ll see impressions, engagements, engagement rate and the type of clicks for every post in the period, and you can filter posts and replies separately. Ranges run from 7 to 90 days or a custom date, and on desktop you can export a CSV if you need to slice the data further.
If you also run ads, the older post activity view in X Ads still separates paid from organic results, which is handy when a promoted post skews your averages.
Top posts
Sort the Content tab by impressions or engagements and your top posts rise to the top. Use them as a pattern library to spot which hooks, formats, or topics repeatedly win. It’s one of the easiest ways to build a repeatable content playbook.
One trap: the Likes tab on your profile lists posts you liked, not your most-liked posts. For those, use the Content tab.
Audience tab
The Audience tab breaks down the people who saw or engaged with your posts by age band (from 13-17 to 65+), gender, country, and followers versus non-followers. X notes that gender may be inferred, so read it as a direction, not a census. There’s also a heatmap of when your audience was active over the last 28 days, which is the most useful input for timing your posts.
Video tab
This tab focuses on video performance: views, watch time, average watch time and completion rate, plus a list of your recent videos. It’s where you’ll refine pacing, opening frames, and captions based on how long people actually watch.
X’s Media Studio reports count a video view once at least half of the player has been visible for two seconds. Keep that threshold in mind before you compare X views with another platform’s.
Ads and conversion reports
Inside X Ads, campaign dashboards track impressions, engagement rate, and cost-per-result based on the objective you set. If you’ve enabled conversion tracking with the X Pixel, you’ll also see what happens after someone views or engages with your ad, whether that’s a sign-up, a purchase, or another action tied back to your site or app.
Core X/Twitter metrics to track in 2026
Analytics on X can feel like information overload. Charts, filters, and endless exports can bury the real story. To make sense of it, focus on the signals X puts front and center in Overview, Content and Video, and in Ads. These are the metrics that connect directly to outcomes.
Impressions
Impressions count how often your post was shown across feeds, profiles, and search. It’s the baseline of visibility.
- Why it matters: Without reach, no other metric can exist. Impressions tell you if the algorithm distributed your post widely, or kept it contained.
- How to use it: Compare impressions across campaigns to identify which formats or hashtags push visibility. Keep in mind: impressions are not unique people. The same user can generate multiple impressions, and X counts your own views too.
Engagements & engagement rate
Engagements count every interaction with a post: likes, reposts, replies, follows, and clicks anywhere on it (links, hashtags, media, your profile photo or name, or expanding the post).
Engagement rate = engagements ÷ impressions × 100
- Why it matters: It’s your quality bar. High impressions with low engagement? You reached people, but the content didn’t land.
- How to use it: Sort posts by engagement rate, not just raw engagement. That way, you spot which posts perform best relative to their reach. If you compare against other tools, check which formula they use; our guide on how to calculate engagement rate covers the main variants.
Profile visits
Profile visits count how many times people opened your profile from one of your posts.
- Why it matters: This is curiosity in action. It’s the bridge metric between engagement and new follows or link clicks in your bio.
- How to use it: Track spikes after campaigns or viral posts. If profile visits rise but follower count doesn’t, review your profile picture, bio, and pinned post, because they’re not converting visitors.
Conversation signals (replies and reposts)
Replies and reposts break out from the generic “engagements” category. They’re direct markers of conversation.
- Why it matters: These actions amplify your content (via reposts) and build public dialogue (via replies). They’re also signals of resonance: people don’t reply to content they don’t care about.
- How to use it: In the Content tab, review posts with high repost and reply counts. Use them as cues for future conversation starters or campaigns with built-in virality.
Follower growth
Follower growth over time is more telling than the number itself. X reports new follows as a gross number, so subtract unfollows to get your net growth.
- Why it matters: Net gains (or losses) reflect whether campaigns are bringing in a lasting audience. It’s also a proxy for brand momentum on the platform.
- How to use it: Align follower spikes with content calendars, PR announcements, influencer collabs, or ad pushes. Dips can be just as telling: did a campaign message miss the mark?
Link clicks & media clicks
Link clicks count clicks on the URLs in your posts. Media clicks show curiosity about your visuals.
- Why it matters: These metrics measure intent. Someone took action beyond scrolling. A click isn’t a visit, though: some people leave before your page loads, so your web analytics will always show fewer sessions.
- How to use it: Pair link clicks with UTM parameters to verify traffic inside your web analytics. Test headlines, preview images, or card setups when click-through is low.
Video metrics: retention, view rate, completion rate
Video reports go deeper than basic view counts.
- Video views – counted once at least half of the player has been on screen for two seconds.
- Retention – the average share of the video people watched.
- View rate – video views as a share of the times the video was shown.
- Completion rate – the share of video views that reached the end.
- Why it matters: Raw view counts are vanity without retention. Completion rate shows if your story arc worked.
- How to use it: Test your hook (first 3 seconds), pacing, and subtitles. Shortening videos or front-loading your CTA often boosts completion.
Detail expands, bookmarks and shares
Three less obvious signals are worth a column in your report. Detail expands count how often people opened your post to read it in full, which is a good test of whether a long post’s first line earns the click. Bookmarks are private saves: you see the count, not who saved it, and X reports them as a public post metric. Shares count how often people shared your post onward. A post with modest likes and lots of bookmarks is usually reference material people plan to come back to.
Can you see X analytics for another account?
Only partly. For any public post, X shows everyone the view count, likes, reposts, quotes, replies and bookmarks. The rest (link clicks, profile visits and the account-level trends) stay with the owner: X lists link clicks and profile clicks as non-public metrics that need the owner’s authorization.
What you can do depends on whose account it is:
- A client or colleague’s account. Ask for access. X’s delegate feature lets an account owner give teammates access without sharing a password, or the owner can connect the account to a reporting tool you both use.
- A competitor’s account. You only get public numbers, so track them consistently: same metrics, same period, logged daily or weekly. Our guide to X/Twitter competitor analysis walks through a benchmarking template.
Be wary of sites that promise another account’s “full analytics”. Without the owner’s authorization, they can only estimate from public counts.
How to calculate real ROI from X/Twitter analytics
Metrics are only useful if they connect to outcomes.
Impressions, engagement rate, and follower growth tell you what’s happening on-platform. But the real question marketers need to answer in 2026 is simpler:
Is X driving measurable business value, or just activity?
With analytics behind a paid plan and ad costs that move month to month, you need a clearer way to translate analytics into ROI.
Here’s a practical model you can use.
The X ROI funnel: from impressions to revenue
Most performance on X follows the same path:
Impressions
→ Engagement
→ Clicks or profile visits
→ Conversions
→ Revenue
The mistake is stopping at the top.
High impressions without clicks are awareness.
High engagement without conversions is resonance.
But ROI comes from what happens after the post.
A simple ROI calculation you can apply
Let’s turn your X analytics into a measurable funnel.
For example, a campaign post generates:
- 100,000 impressions
- 3% engagement rate → 3,000 engagements
- 8% of engagements become link clicks → 240 clicks
- 5% website conversion rate → 12 conversions
- $120 average order value
Revenue: 12 × $120 = $1,440
Now, let’s compare that to cost; if you spent:
- $800 on ads
- $8/month on X Plus for analytics access
- $200 of team time (say, 4 hours of content and reporting at $50 an hour)
Total cost ≈ $1,008
ROI: (1,440 − 1,008) ÷ 1,008 = 43% ROI
That’s the difference between reporting metrics and proving impact. Leave the team time out and the same campaign looks like a 78% return, which is why it belongs in the sum.
Why it matters: engagement is not the finish line
X makes it easy to obsess over impressions or likes. But those numbers don’t tell you if your content is moving people toward action.
Instead, focus on metrics that signal intent:
- Link clicks
- Profile visits → bio conversions
- Conversion tracking (Ads)
- Video completion (for product storytelling)
These are the bridges between visibility and revenue.
Organic vs paid: ROI works differently
Not all performance should be judged the same way.
| Signal | Organic posts | Paid campaigns |
|---|---|---|
| Primary value | Brand + trust | Conversions + scale |
| Attribution clarity | Medium | High |
| Cost | Time + team resources | Budget-driven |
| Testing speed | Slower | Faster |
Organic content builds long-term demand.
Paid campaigns capture demand quickly.
The smartest strategy is using analytics to decide when to lean into each.
When X might not be worth the investment
Analytics is also how you know when to stop. Set your own baseline from the last three to six months, then watch for these patterns:
- Engagement rate keeps falling below your own baseline, month after month
- Link click-through stays low even after you’ve tested new headlines and preview images
- Your conversions come mainly from other channels
- Your audience isn’t active in your niche on X
In those cases, impressions become noise instead of growth.
The takeaway: Measure what moves the business
In 2026, the teams winning on X aren’t the ones chasing viral posts.
They’re the ones who can answer:
- What drives clicks?
- What drives conversions?
- What’s repeatable?
- What’s profitable?
So, once you treat X analytics as a revenue model, not a vanity dashboard, you stop guessing and start investing with confidence.
How to audit your X/Twitter account: 7 checks for better decisions
An X/Twitter audit is a review of your account’s profile, content and audience over a set period, ending in a short list of what to repeat, stop and test. Pick the period first (a month or a quarter) and compare it with the one before, so every number has context. Here’s the order we’d run it in.
Start with the profile
Before any numbers, look at what a new visitor sees: your profile photo and header, your X bio, the link, and your pinned post. Is the handle consistent with your other channels? Does the pinned post still reflect what you’re promoting? A profile that converts visitors makes every other metric in this audit work harder.
Top posts: what made them work
In the Content tab, sort the period’s posts by impressions and then by engagement rate. Open the top few to see the engagement broken down into link clicks, profile visits, and more.
By seeing what your top-performing posts were, you’ll be able to assess why they resonated so well with your audience. Perhaps it was the use of a certain emoji, a certain call-to-action, or the use of consistent corporate branding. You can then replicate these elements in future posts to spike engagement in a similar way.
Follower growth
In Overview, check new follows and unfollows across the period, not just the follower total.
Having access to this data can help you assess highs and lows in your follower count and correlate these trends to the content you published on those days. With this information, you can determine what content your audience is enjoying and what content is potentially prompting people to unfollow you.
This is an integral part of the audit, particularly for marketers who are looking to grow their follower counts. After analyzing these details, you can also consider a followers campaign in X Ads to increase your number of engaged followers.
Follower demographics
In the Audience tab, check age, country and the split between followers and non-followers.
You can shape your messaging based on this information to ensure higher levels of engagement in future posts. For example, if most of the people engaging are 25 to 34 and based in the UK, your references, posting times and offers should fit them, not the audience you assumed you had.
Mentions
X’s current analytics doesn’t have a mentions report, so use search: look up your @handle and your brand name without the @ for the audit period. X’s advanced search lets you filter by date, replies and minimum engagement.
This is also particularly valuable from a customer service standpoint as you can track which of your customers are mentioning your account in their posts, asking questions, airing concerns or grievances about customer service, and more.
Conversions from X
For ads, X’s conversion tracking shows whether someone who saw or engaged with your Twitter Ads went on to sign up or buy. For organic posts, tag every link with UTM parameters and check the sessions and conversions in your web analytics.
This lets you clearly see the ROI of your X activity, and it shows which posts brought visitors who actually did something.
Check follower quality (fake followers)
If your follower count jumped without a matching rise in engagement, check for fake or inactive followers. X doesn’t give accounts a follower-quality score, so you’ll need a third-party checker. TwitterAudit, now part of Fedica, and FollowerAudit both audit any public X account. SparkToro’s free fake-follower tool, which older guides recommend, is gone.
Read their scores as estimates. A follower with no photo and no posts may just be a lurker, so look for patterns (hundreds of new followers in a day, all created the same week) rather than judging single accounts.
How to use X/Twitter analytics to improve your strategy
Analytics and X insights can only be powerful if you act on them. Numbers shouldn’t be a scoreboard. They should guide your next move and tie performance back to real business results.
Here’s a brief YouTube video that explains how to grow a small X/Twitter account by making the algorithms love you:
Set benchmarks and goals
X’s potential ad reach was 450 million people in April 2026, so even small percentage gains could mean thousands of extra eyes. Attention is split across a lot of apps, though. You’ll need clear goals, like lifting engagement rate by 20% or boosting link clicks by 30%, to know what progress looks like.
Refine content strategy
Your analytics will show you which formats work. If threads consistently outperform single posts, or polls drive more profile visits, you should lean into those. The point isn’t guessing; it’s spotting repeat wins and repeating them.
Experiment and test the impact
You could run A/B tests with hooks, visuals, or CTAs. Compare engagement rate, clicks, or conversions across versions. Simple tests, say, posting a thread vs. a single image, might reveal what your audience actually prefers.
Optimize posting schedule
Check when your followers are most active. The Audience tab’s activity heatmap shows the last 28 days by day and hour, so you don’t have to guess from your time zone. Post when they’re online, and you’ll likely see stronger impressions and engagement.
Avoid vanity metrics
Big follower counts or impression totals might look nice, but they don’t tell you much. Instead, focus on profile visits, link clicks, conversions, or video completion rates. These are the metrics that actually map to business outcomes.
Limitations of native X/Twitter analytics you should know
Native analytics will give you a solid start, but there are gaps you should keep in mind. The account dashboard sits behind a paid plan, a gate that dates back to after Elon Musk bought Twitter and rebranded it as X. It shows one account at a time, has no competitor benchmarking, and its audience data describes the people who saw your posts rather than a full profile of your followers. Exports are per tab and per account, so a monthly report across several handles means stitching CSVs together by hand.
Which X/Twitter analytics tool should you use?
Start with the reporting job, not the feature list. One account and a monthly check-in is a different job from ten client accounts and a competitor benchmark every Monday.
| Tool | Best for | X data you get | Watch out for |
|---|---|---|---|
| Native X analytics | One account | Post analytics free; full dashboard with Plus | One account at a time, CSV per tab |
| Sociality.io and Sociality MCP | Several brand or client accounts, plus competitors | X analytics, competitor benchmarking and scheduled reports next to your other channels; ChatGPT, Claude or Gemini can query the same data | History depends on your plan; the MCP is read-only |
| Fedica (includes TwitterAudit and Followerwonk) | Follower analysis and audits | Follower audits and audience insights | X-focused; not a cross-channel report |
| FollowerAudit | A one-off fake-follower check | Follower-quality estimate for any public account | Scores are estimates |
Before you pay for any tool, check its current X coverage. The X API is now pay-per-use, priced per post or user read, so every tool’s X integration has its own limits. Ask which metrics it pulls, how far back it goes, and whether it can export in the format your stakeholders want. For a wider comparison across channels, see our roundup of social media analytics tools.
How to export and report on X/Twitter analytics data
Once you’ve collected your numbers, you’ll need to package them into something useful.
With native analytics, you can export CSV files from the Overview, Content and Video tabs on desktop. That gives you the raw data for impressions, engagement, profile visits, clicks, and video metrics. Note the date range and time zone in the file name, so next month’s export compares like with like, then load it into Sheets or Excel, build charts, and map them against campaign dates.
If you prefer a manual report, pick 3–5 core KPIs (like engagement rate, follower growth, or conversions), add visuals, and write a short story that links results to actions. Always finish with recommendations, not just data.
AI is now part of many reporting workflows but the best teams use it with guardrails. In our 2026 survey, 78.4% of marketers said they apply moderate or extensive editing before publishing AI-assisted content. That same principle applies to analytics summaries: use AI to speed up drafts, patterns, and narrative structure, but keep humans responsible for interpretation, context, and factual accuracy.
A simple AI-assisted reporting workflow (that stays accurate):
- Export your X analytics CSV (Content or Video tab) and paste key rows into your report doc.
- Ask AI to: summarize trends, flag anomalies, and draft 3–5 insights with the numbers quoted back.
- Manually verify every metric claim against the CSV.
- Add context AI can’t know: campaign notes, creative changes, budget shifts, seasonality.
- Finish with decisions: what to repeat, what to stop, what to test next week.
Conclusion: Why X/Twitter insights & analytics help you grow smarter
X/Twitter still reaches hundreds of millions of people. That makes it a powerful channel, but also a competitive one. You’ll need analytics to see what works, what falls flat, and where your audience is actually paying attention. This way you’ll get more X/Twitter followers and increase your engagement.
From impressions and engagement rate to profile visits, follower growth, and video completion, the native dashboards give you the building blocks. Check your post analytics weekly, run the audit monthly, and put X in the same report as the rest of your social media analytics so it gets judged on the same terms.
FAQs about X/Twitter analytics
Can I track several X accounts in one report, or ask ChatGPT about them?
Native X analytics shows one account at a time, so teams with several handles usually export and merge CSVs by hand. Sociality.io puts your X accounts, your other channels and tracked competitors in one scheduled report. Sociality MCP lets ChatGPT, Claude or Gemini read the same data, so you can ask which X posts drove the most engagement last month.
How do I see X/Twitter analytics?
On desktop, sign in and open x.com/i/account_analytics for the full dashboard with Overview, Audience, Content and Video tabs. It needs X Plus or a higher plan, or a legacy Premium subscription. For a single post, click the bar chart icon under it to open Post analytics, which is free on your own posts and shows impressions, engagements, profile visits and link clicks.
Is X/Twitter analytics no longer free?
Partly. Analytics for your own posts is still free: impressions, engagements, detail expands, profile visits, link clicks, likes, reposts and replies. The account dashboard, with trends, audience data, video reports and CSV export, needs X Plus at $8 a month or $80 a year, or a higher X Subscription plan. A free account sees an upgrade screen instead.
Does X/Twitter show who visited your profile?
No. X shows how many profile visits your posts generated, not who made them. People who like, reply, repost or follow are visible, but anyone who only opens your profile stays anonymous. Apps that promise a list of your profile visitors can’t get that data from X, so treat them with suspicion and don’t hand over your login.
Do X/Twitter analytics count your own views?
Yes. X counts views from logged-in accounts, and that includes the author’s own views and repeat views of a post, so a small account that checks its posts often inflates its numbers a little. Views of posts embedded on other websites aren’t counted. For a cleaner signal, compare engagement rate and link clicks across posts rather than raw impressions.
How do you check your X/Twitter score?
There isn’t one. X has no official account score or quality rating in its analytics. Third-party tools such as TwitterAudit, now part of Fedica, give a follower-quality score that estimates how many of your followers look fake or inactive, but that’s the tool’s own estimate. Use it as a prompt to look closer, not as proof.
What counts as an engagement on X?
An engagement is any interaction with a post: likes, replies, reposts, follows, and clicks anywhere on it, including links, hashtags, media, your profile photo or name, and expanding the post. Engagements count actions, not people, so one person who clicks twice counts twice. Engagement rate is engagements divided by impressions, multiplied by 100.
Do you need a third-party X analytics tool?
Not always. If you run one account and only need monthly numbers, X’s own post analytics and the Plus dashboard are enough. A third-party tool earns its place when you report on several accounts, need history beyond what you export, want competitor benchmarks, or send the same report to clients every month. Check that its X data is current before you pay.