11 essential YouTube KPIs to measure your channel’s growth
Summarize this article via
One billion.
That’s the number of hours we as humanity spend on YouTube every day.
It sounds like a whole lot of time and a great amount of content consumed daily. But that shouldn’t come as a surprise as we know how powerful YouTube has become. And how popular videos have become among businesses and consumers.
But despite the undoubted benefits, YouTube has in store for brands worldwide, getting started with YouTube and building a successful brand can be tricky.
Why?
One reason is down to analytics and performance tracking. YouTube has its own set of KPIs, which are different from other marketing channels. This makes it difficult to begin optimizing your YouTube strategy.
But don’t worry.
This post will cover 11 essential YouTube KPIs to monitor when measuring your channel’s growth and how you can use them to drive your channel forward.
So without further ado, let’s begin.
11 Essential YouTube KPIs
What are the eleven YouTube KPIs that you should closely monitor?
Watch time
Your watch time on YouTube refers to the amount of time your viewers have spent watching your videos. This metric is YouTube’s number one ranking factor which makes it essential for you to track.
If people spend a lot of time watching your videos, it tells YouTube’s algorithm that those videos must be engaging. Therefore, YouTube promotes your channel to more people in their home feed or search section — leading to more views for you.
You’ll get access to information concerning your watch time in YouTube’s watch time report. By comparing the watch time of different videos, you’ll be able to rank them and determine which content types are the most engaging.
Average view duration
This metric shows your video’s ability to keep a viewer engaged. It can be likened to Google’s SEO metric, Bounce Rate.
If your video doesn’t engage your audience, they will bounce off in search of more valuable content, leaving you with a poor average view duration. But if you create engaging content and your average view duration increases, your watch time will also increase, leading to more visibility for you.
Your video’s average view duration can also assist you in making key strategic decisions. For instance, if you discover that most of your viewers stop watching your videos at a particular moment, you can dig in to find out why that is so. And make changes that can help increase your YouTube exposure.
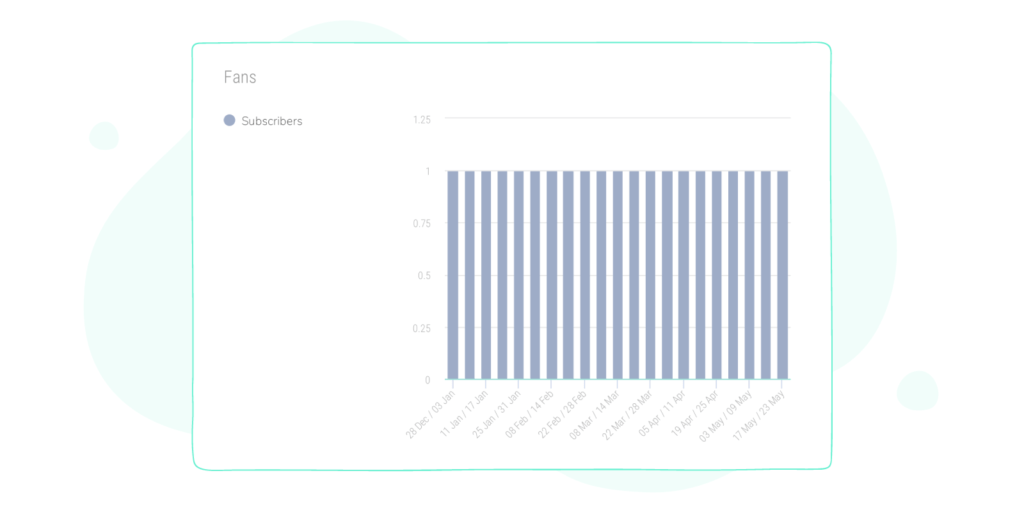
Subscriber growth
Subscribers are fans of your channels who have agreed to stay updated with your videos. They’ll usually see your videos in their feed. And if they have their notification turned on, they’ll get alerted anytime you release a new video.
Because subscribers watch twice as many videos as non-subscribers, they are key to improving your YouTube channel’s watch time.
By digging into the type of videos your subscribers watch, you can find content that your ideal audience likes and make more of those content types. This way, you’ll be able to build an audience that is interested in the message you are passing across.
YouTube’s subscriber report will give details on how many period subscribers you lose or gain, which videos are responsible for bringing in the most subscribers.
Related article: Top 5 YouTube habits to adopt to double your subscribers in 2021
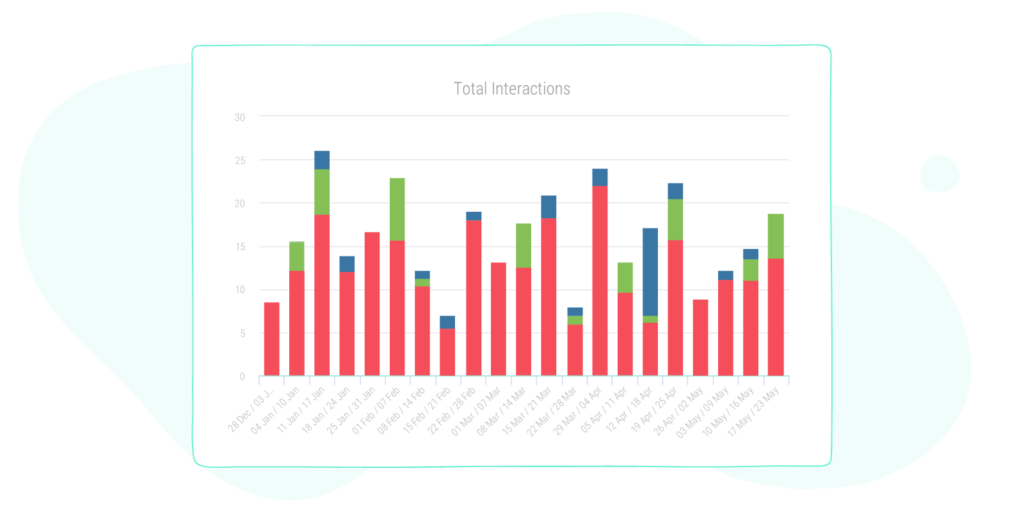
Engagement
A viewer is said to have engaged with your video if he or she takes action on the video. Such action can include likes, dislikes, comments, and shares. They provide insights into what your viewers think of your content.
Comments tell you how your viewers feel about your videos. Depending on the tone of the comments, you can decide if the general feeling is good or bad. Likes and dislikes are a good way to judge if your audience likes your content direction or content type. Shares are the most telling. You know that you are doing something great if your viewers feel motivated enough to encourage others to watch your videos.
Number of video views
On its own, the total number of views a video has isn’t that much of an important KPI. It lost its status as the number one YouTube ranking factor to Watch Time. But that doesn’t mean that the number of video views you get is useless when measuring your channel’s growth.
It becomes an important metric and opens a whole can of insights to you when you combine it with a KPI such as average view rate.
With the combination of those two KPIs, you’ll have a better idea of which one of your videos is popular among your audience and which ones aren’t doing so well.
For example, if a video has a lot of views but you find out that the average view duration isn’t satisfactory, it could mean that the viewers aren’t happy with your content. You can then take a critical look at the video and find out the cause of the disconnect.
Cards click-through rate
Cards are interactive notifications that you can add to your video and use to prompt your viewer into taking a particular action. They appear as rectangular boxes, and you can use them to promote your content or other creators’ content, promote your channel, sell your merchandise, and so on. Here’s what a card might look like.
Each card have might have different click-through rates and this tells you what actions your viewers perform the most after watching your videos. In the YouTube top cards report, you will find which cards your viewers clicked on the most across all the videos in your channel. With the data available, you may be able to figure out the best time and place to show your cards in your videos.
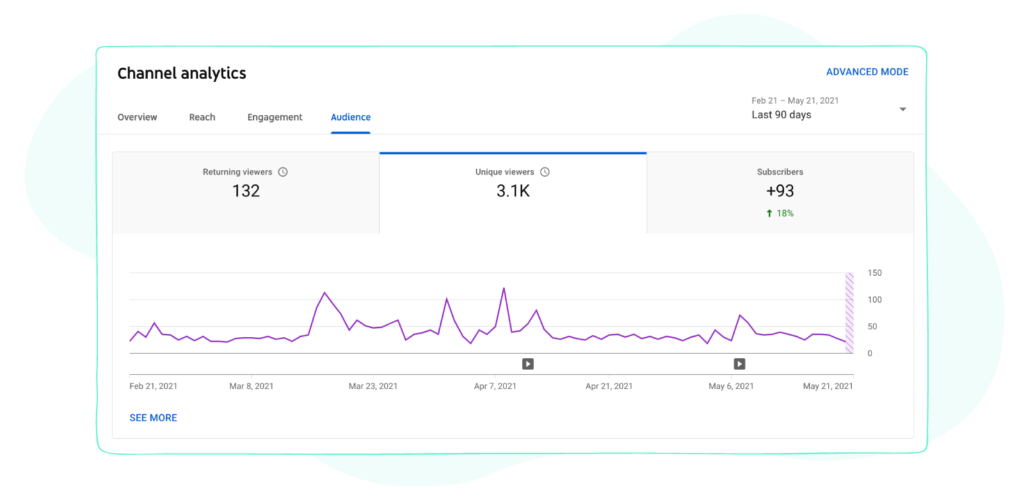
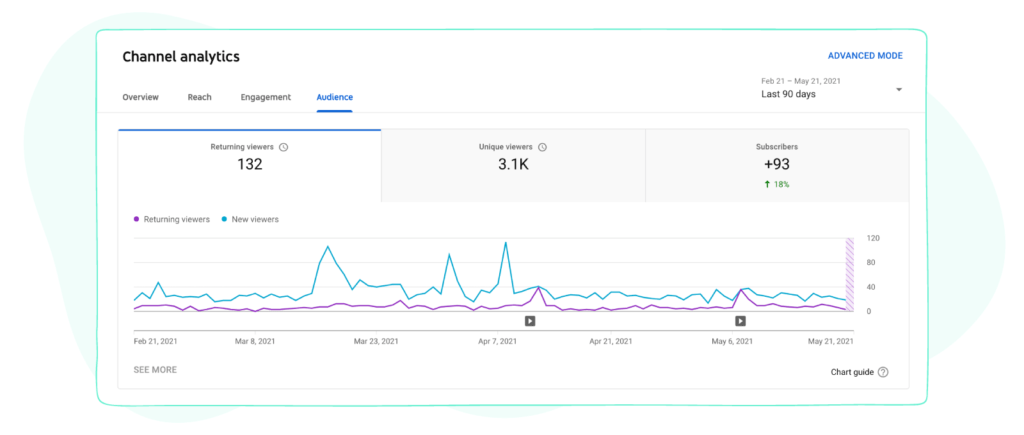
Number of unique viewers
The number of unique viewers is a metric that helps you understand how active your audience is. It tells you how many different people have watched your video over a given period of time.
Since the IP address is used to differentiate each viewer, it doesn’t matter if someone watches more than once or with different devices, that person will be counted as a unique viewer.
This metric is useful for a couple of reasons. First, It tells you how engaged your audience is. If you have a high number of unique viewers for a video compared to your subscriber count, this could be an indicator to continue making more videos like that.
But if the number of unique viewers is small compared to your subscribers, you can try prompting them to turn on their notifications for your new videos. This metric is also key if you plan on negotiating sponsorship deals. Brands would love to know how large your audience is.
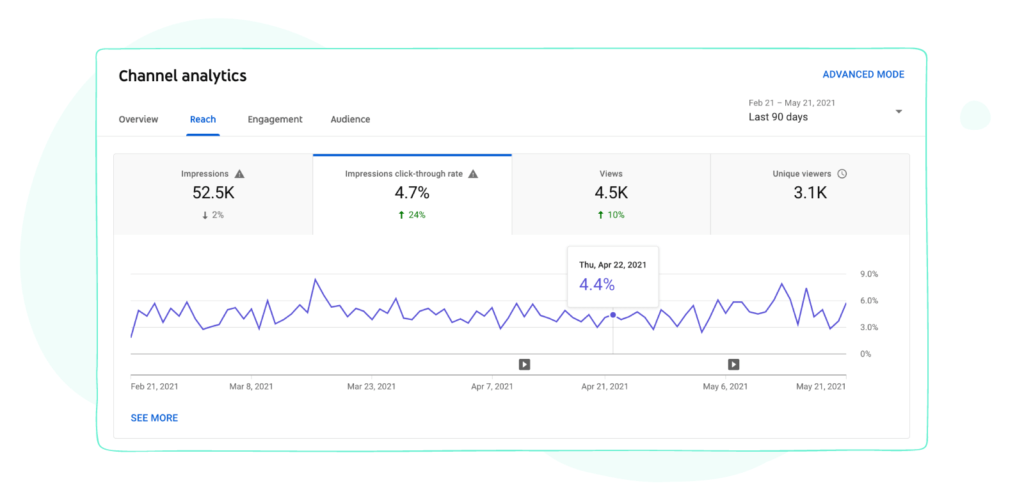
Impression click-through rate
This tells you what percentage of your video impression turned into views. A high impression click-through rate means that viewers find your thumbnail and video title compelling enough that they clicked on your video.
But a high click-through rate doesn’t always mean success. You could have a high impression CTR but if you notice that that video has a low average view duration, it means that your viewers aren’t staying on to watch the video after clicking on it. Therefore, you should always analyze this metric alongside other KPIs like average view duration and traffic sources.
You should also note that impression click-through rates are usually at their highest after you just released a video. This is when your subscribers see the videos at the top of their homepages. But as your impression increases and your videos get shown to a wider audience, you should expect this metric to decline until it reaches a stable rate.
Audience retention
Audience retention tells you how much of your video your audience watches. Videos with high audience retention are favoured by YouTube as it means viewers are staying on till the end.
In the audience retention report, you can also find details on what part of your video your audience rewatch and the point where they start to leave.
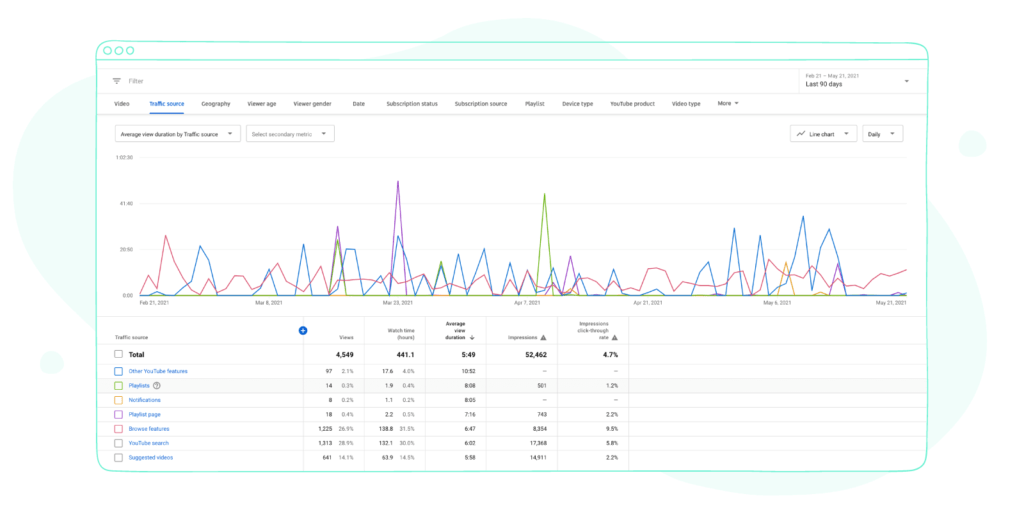
Traffic sources
Tracking who your audience is and where they come from helps you understand them better. Once you understand how a viewer finds you, it is much easier to target the right keywords and add better tags that will put you in front of similar viewers.
By diving into the data available in YouTube’s Demographic report, you’ll be able to compare who watches your video by age, gender, or geography. This way, you’ll know who your most engaged audience is and make better marketing decisions.
Playlist engagement
Adding your videos into a playlist is a great way to organize them based on their topics or theme. By grouping similar videos, you’ll make it easy for your viewers to find your content and keep watching, increasing your channel’s watch time.
Some metrics to track to understand your playlist engagement are playlist exit rate, average time in playlist, and views per playlist. The playlist exit rate of a video is the percentage of viewers that exit a playlist on that video. If a video has a high playlist exit rate, it might be a sign to remove the video from the playlist or push it to the end of the playlist.
The average time in the playlist is the average time a person spends watching a playlist before exiting. And view per playlist is the average number of views your playlist has.
Generally, you can get more people to watch your playlist and improve these metrics by putting videos with high audience retention at the top of the list.
Conclusion
Like every other marketing strategy, the ability to track and analyze these key metrics is crucial. No matter how good your content is, you want to make sure that you are constantly hitting those YouTube goals (and business goals too).
But it is easy to get overwhelmed by the sheer amount of trackable metrics available. These 11 KPIs will help you focus on what matters and assist you in driving your channel’s growth.
Better to look at 👉 Reasons why you should stop measuring social media vanity metrics
While most of these KPIs can be found in your YouTube analytics account, you should consider how tools like Sociality.io can help you make the management of your channel easier.
With Sociality.io, you can schedule your content to be published across different platforms (including YouTube), engage with your social media audience on one page, generate reports on all your social media platforms in an easy-to-understand format, and so much more.
According to Erhan Özkantarci, associate general manager at Vivaci Turkey, Sociality.io is one of the most valuable software at Vivaci Turkey as it saves their time and that of their clients.
And he’s not the only one who thinks so.
So, do you want to join Mehmet and over 2000 marketers to track your social media growth and use period real-time data to drive results?
Sign up here for a 14-day free trial. No credit card required.