Most important social media KPIs that you should track
Summarize this article via
Today we’ll discuss the most important social media KPIs you should track. You’ll see the most must-have KPIs here, but remember that according to your brand’s current needs and future strategies, you might need to add more to your list.
With great content and customer success stories, you build strong, personal, and long term relationships with your followers, and social media KPIs are used to keep track of revenue, reach, and overall ROI coming from those followers so that you can look into the ways of increasing leads, generating more revenue and expanding your brand.
Before we go into the nitty-gritty of the KPIs you should track, let’s run through the basics of social media KPIs and how to set one.
What are social media KPIs?
Social media KPIs, or key performance indicators, are metrics used to measure the effectiveness of social media strategies and activities. These metrics provide insights into various aspects of social media performance, such as audience engagement, content reach, follower growth, and click-through rates.
By tracking and analyzing these KPIs, businesses can evaluate the success of their social media efforts and make data-driven decisions to optimize their strategies. Social media KPIs help businesses understand how well they connect with their target audience and achieve their goals on social media platforms.
What is KPI reporting?
KPI reporting refers to the process of collecting and analyzing key performance indicators (KPIs) to evaluate the success of a particular strategy or activity. It involves tracking and measuring specific metrics to assess the performance and effectiveness of a business’s goals and objectives.
KPI reporting provides visual representations and insights through reports and dashboards, allowing businesses to make informed decisions and adjust their strategies. By regularly monitoring and reporting on KPIs, businesses can identify trends, measure progress, and identify improvement areas to achieve their desired outcomes.
Why are social media KPIs important?
Before diving into setting KPIs, it is essential to understand their significance. Social media KPIs provide you with valuable insights into your social media performance. They help you gauge your success, measure your ROI, and identify areas for improvement. Without clear and measurable KPIs, assessing your social media efforts becomes challenging. Social media KPIs play an important role in identifying potential customers. Through social media analytics, one can measure user engagement, sentiment, and intention. Today, nearly half of all companies incorporate social media KPIs into their sales and growth strategies.
How to set social media KPIs
Identifying your objectives
The first step in setting social media KPIs is identifying your objectives. What do you want to achieve through your social media presence? Your goals could vary from increasing brand awareness, driving website traffic, boosting engagement, generating leads, or even increasing sales. Once you determine your objectives, selecting the appropriate KPIs that align with your goals becomes easier.
Selecting the right KPIs
When selecting KPIs, it is crucial to choose metrics that are relevant to your objectives. Here are a few commonly used social media KPIs:
- Reach: Measure the number of people who see your content.
- Engagement: Track likes, comments, shares, and other interactions.
- Click-through Rate (CTR): Measure the percentage of users who click on your content.
- Conversion Rate: Track the percentage of users who take the desired action, such as making a purchase or filling out a form.
- Customer Lifetime Value (CLTV): Assess the long-term value of a customer gained through social media.
Remember, the KPIs you choose should be specific, measurable, achievable, relevant, and time-bound (SMART). Setting SMART goals will help you stay focused and track your progress effectively.
Setting realistic targets
Once you have selected your KPIs, it is essential to set realistic targets. Analyze your past performance, and industry benchmarks to establish achievable goals. Setting targets that are too ambitious or too easy to reach can hinder your progress and motivation. Aim for steady growth and incremental improvements over time.
You should also be specific while setting these targets. For example, instead of aiming to “increase engagement,” set a target like “increase average engagement rate by 10% within the next quarter.” Specific targets help track progress and evaluate the success of your social media efforts.
Choose the right metrics and tools
Determine the metrics and tools you will use to measure your chosen KPIs. Most social media platforms provide built-in analytics tools that offer insights into various metrics like reach, engagement, and follower growth. Additionally, third-party social media management tools or analytics platforms can provide more comprehensive data and reporting capabilities. Choose the tools that align with your needs and budget.
Monitoring and analyzing the results
Setting social media KPIs is not a one-time task. Regularly monitor and analyze the results to measure your performance. Use social media analytics tools to track your KPIs and gather insights into what’s working and what’s not. Based on the data, adjust your strategies and tactics accordingly to achieve better results.
✨ Related Article: How to track and understand social media analytics
Refine and optimize your approach
Based on the insights and data you gather, refine and optimize your social media strategies. Experiment with different content formats, posting schedules, messaging, and targeting to improve your KPIs. Test different strategies and tactics and measure the impact on your chosen metrics. Continuously optimize your approach based on what resonates with your audience and delivers the desired results.
Report and communicate results
Regularly report on your social media performance and communicate the results to relevant stakeholders. Prepare clear and concise reports highlighting progress, achievements, and areas for improvement. Use the data and insights to inform future decision-making and investment in social media activities.
When you want to start out measuring and tracking KPIs, ask these questions for yourself first:
- Am I reaching the right and qualified audiences?
- Am I engaging with the right and qualified audiences?
- How many of my followers are looking into my product/services and becoming my customers?
Realize that each question can be answered under these 3 areas:
- Reach
- Engagement
- Conversions
✨ Related article: Which is more important: Reach vs. Impressions
If you’re not familiar with such terms, please check the article for the ultimate glossary of social media terms every marketing person should know!
Let’s look into what gives us what.
KPIs for reach
Reach shows you how many people come across your post since it went live. The impression is about the number of times that post has shown up in someone’s feed since it went live.
Audience Growth Rate
% Growth rate: (new followers/total followers) x 100
Audience Growth Rate measures your follower count in a specific given period. You can measure how quickly your audience grows on your social media channels by comparing months, weeks, years, etc.
Post Reach
% Post reach: (post views /total followers) x 100
Post reach shows how many people have seen your post since you published it. You can compare your posts and find trends on what kind of content works or what time of the day gets more reach.
Social share of voice
%SSoV: (mentions/all other mentions) x 100
People follow you, like or comment on your posts, and mention it directly with a @ or indirectly. If you count your mentions and calculate your Social Share of Voice, you’ll realize how many people (both your followers and users who don’t follow you) mention your brand over your competitors. And once you find that ratio, you can decide how relevant your content is in your market.
KPIs for engagement
Engagement is all about interactions. Let’s find out KPI’s for likes, shares, retweets, and more.
Applause rate
%Applause rate: (likes/followers) x 100
Applause Rate lets you find out how many people like your posts compared to your total followers. Keep track of the applause rate of your content, and you’ll have a better idea of what kind of content makes people like your posts, so you start sharing the right content.
Average engagement rate
% Average engagement rate: ((likes + comments + shares) / followers) x 100
The Average Engagement Rate goes deeper than the Applause Rate. Here, you’ll sum up all the likes, shares, and comments relative to the number of followers of your brand. Of course, the higher the rate, the better!
Bonus articles:
- How to calculate engagement rate on social media?
- Explained: How to calculate and boost Instagram engagement rate
- Your average Twitter engagement rate: Everything you need to know
Amplification rate
% Amplification rate: (shares / followers) x 100
When people share your content on their feeds, they share it with their own networks. This simply means that they care about what you’ve shown them and want their network to know about it, right?
Amplification Rate is measured by counting the shares for a post of your brand for a specific period of your choice, dividing them by your total number of followers, and multiplying it by 100.
As you calculate your Amplification Rate, you’ll realize the details of your most shared contents and start building upon them. Just like the Applause Rate or Average Engagement Rate, the higher this is, the better.
Virality rate
% Virality rate: ( shares / impressions ) x 100
Everyone wants to be viral, but everyone actually is! Remember, the impression is about the number of times your post has shown up in someone’s feed since it went live.
Virality Rate measures the number of people who shared your post relative to the number of people who saw it. You take a reporting period, count the total number of impressions and shares for a specific post, divide shares by impressions, and multiply by 100. This will tell you how viral that post went!
✨ Related article: Viral marketing 101: Definition, examples, and where to start in 2023
KPIs for conversions
How many of my followers are looking into my product/services and becoming my customers? Conversion answers this. How effective are you on social media? Are your followers doing what you asked them to do?
Conversion rate
% Conversion rate: (conversion / clicks) x 100
Conversion Rate is the simplest answer to the question of, ‘Are your followers doing what you asked them to do?’ You post something with a Call-to-Action link. They click on it as you ask them to. The higher the Conversion Rate is, the more loyal your audience becomes and the more confident you become of your social media content.
Click-through rate (CTR)
% CTR: (CTA Clicks of a single post / impressions) x 100
Click-Through Rate is the rate people click on your call-to-action links.
Bounce rate
Let’s say your followers click on the CTA link, but then they leave the landing page without completing the CTA on the page. This means they are bounced back. They didn’t finish. Keep track of your bounce rate for organic and sponsored content. You’ll realize what works better, what doesn’t work, whether your audience is the ideal one, or should you change some of your targets?
The lower the rate, the better!
Cost-Per-Click (CPC)
CPC: ( ad spend / clicks)
Cost-Per-Click measures the amount of money you pay per click on sponsored social media content. It gives you much better insight compared to your total budget. Keep track of your CPC’s to understand whether your investment is efficient or not.
Cost per Thousand Impressions (CPM)
CPM: (ad spend / impressions)
Cost per Thousand Impression measures the amount of money you spend after 1000 people see your sponsored content. This is not to understand if your investment is efficient or not, but to forecast your future campaigns.
Having a high bounce rate is no good but it’s still good that you realize it.
A social media KPI template to get you started
Reach and engagement
- Increase average reach by X% over the next quarter.
- Increase average engagement rate by X% within the next six months.
- Achieve a minimum of X likes, comments, and shares per post.
Follower growth
- Increase the number of followers by X% over the next year.
- Gain X new followers per month.
- Achieve a follower growth rate of X% month-over-month.
Click-through rate (CTR)
- Increase CTR on social media posts by X% in the next quarter.
- Achieve a minimum CTR of X% for all social media campaigns.
- Increase the number of website clicks from social media by X% over the next six months.
Conversion rate
- Increase the social media conversion rate by X% within the next year.
- Achieve a minimum conversion rate of X% for all social media campaigns.
- Increase the number of conversions (e.g., purchases, sign-ups) from social media by X% over the next quarter.
Customer sentiment
- Maintain a positive sentiment score of X% across social media platforms.
- Reduce the percentage of negative mentions by X% within the next six months.
- Increase the number of positive customer reviews and testimonials shared on social media by X% over the next year.
Remember, these templates are just starting points; you should customize them based on your specific goals, industry, and target audience. Ensure your KPIs are specific, measurable, attainable, relevant, and time-bound (SMART) to track your social media performance effectively. Review and adjust your KPIs regularly to align with your evolving social media strategy and business objectives.
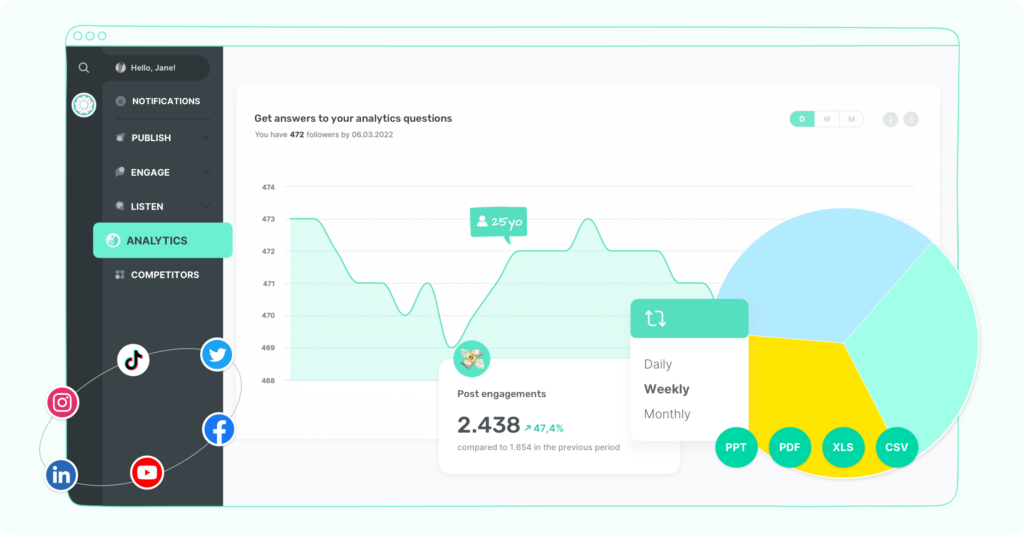
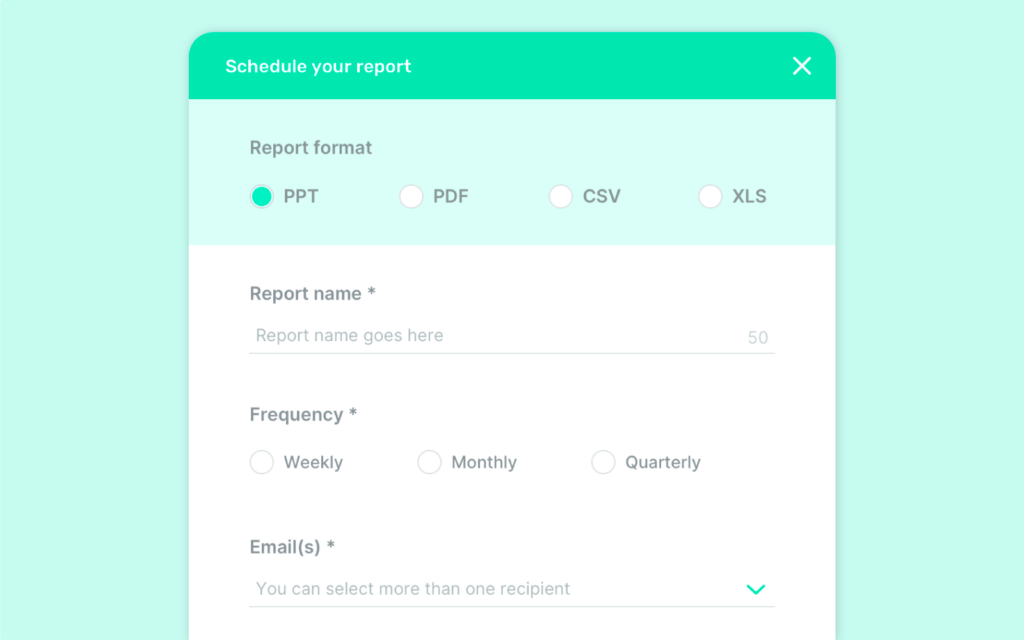
Remember that your weekly or monthly social media report considers all these areas, so you don’t need to manually calculate and find them. Start using Sociality.io for very easy & breezy reporting. Check yourselves here!