


Your average Twitter engagement rate: Everything you need to know
Summarize this article via
As a social media marketer, you know better than anyone that one of the most important social media metrics is engagement rate. Your social media engagement rate can tell you various things about your brand and its performance in the digital space. For example, a high engagement rate conveys that your content is resonating with your followers and customers, so much so that they’re interacting with your posts. Not only does this boost brand awareness, but it can, in turn, increase your sales and profits, benefitting your bottom line.
With that in mind, tracking your average engagement rate across your social profiles is vital to ensuring your brand’s success. One key platform you’ll want to assess? Twitter.
Of all social media platforms, Twitter is one of the most engagement-oriented, with its purpose being “to serve the public conversation.” Here, businesses and customers can interact with one another directly and strengthen the B2C relationship in real-time.
Below, we break down everything you need to know about average Twitter engagement rates – what they are, how to calculate them, and clever ways to boost yours.
What is my average Twitter engagement rate?
To calculate your average Twitter engagement rate, you’ll need to take the number of engagements you’ve received and divide it by the number of impressions you’ve received. Your average Twitter engagement rate can be calculated over your chosen period, whether a week, month, or year.
The average Twitter engagement rate factors in all forms of engagement, including:
- Follows – Users who have followed your account to stay up to date on your posts.
- Likes – Users who click the like button on your Tweet.
- Link clicks – Clicks accrued by a link you included in your post.
- Mentions – Tweets in which users directly tagged your handle (@username).
- Retweets – Shares of your Tweet by clicking the Retweet button.
- Replies – Responses to queries you’ve posed in your Tweets and comments on Tweets.
- Video views – The number of times a user watched your video on Twitter.
Twitter benchmarks: What they are and why they matter
While you now understand what an average Twitter engagement rate is, you may be wondering: what’s considered a good engagement rate?
According to Adobe, there are three general engagement rate benchmarks on Twitter, as outlined in the table below:
| Average Twitter engagement rate (%) | Performance category |
| < 0.5% | Poor |
| 0.5-1% | Average |
| 1% + | Excellent |
However, it’s important to remember that social media engagement rates can vary between accounts, companies, and sectors. As a result, it’s crucial to partake in competitor benchmarking on Twitter; this means you’ll need to set Twitter benchmarks specific to your industry and the other actors within it. We’ll explore specific strategies and tools that can help you do this in the following section.
How to calculate my engagement rate on Twitter
When it comes to calculating your average Twitter engagement rate, you already have the formula (engagements divided by impressions). Luckily, rather than manually calculating your engagement rate yourself, there are platforms that can do it for you.
In this section, we explore the two main strategies for identifying and tracking your average Twitter engagement rate: via Twitter Analytics or a third-party social media management tool.
Tracking your average Twitter engagement rate via Twitter Analytics
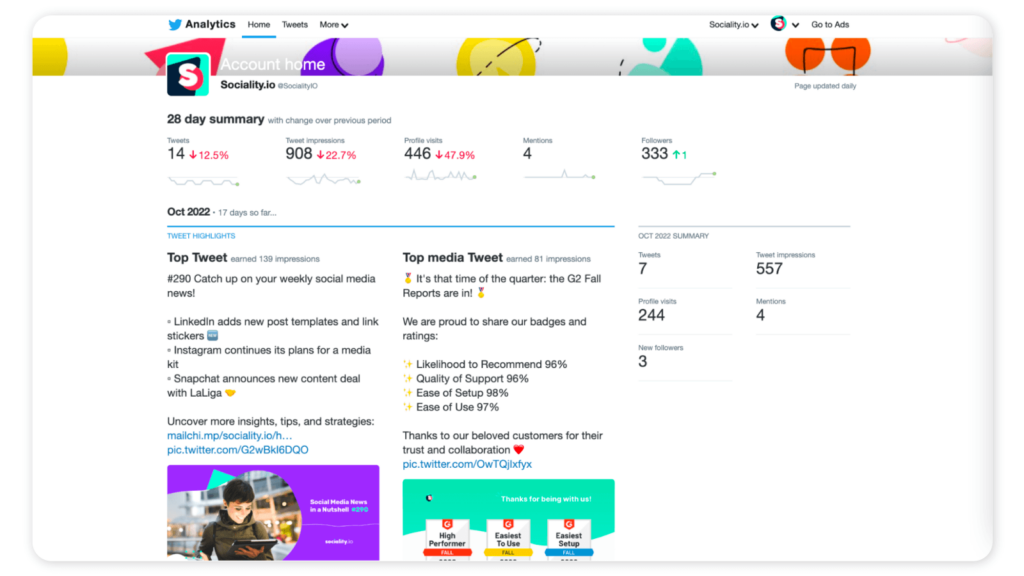
The first tool you can use to track your average Twitter engagement rate is the Twitter Analytics dashboard. From there, click on the Tweet activity dashboard. As a default, you’ll see a 28-day summary with various tidbits of information:
- The number of Tweets you’ve published in this period
- Your total Tweet impressions
- Profile visits
- Mentions
- Followers
Next to each of these social media metrics, you’ll also see a positive or negative percentage that represents your growth or downturn in that period. This section also showcases your Top Tweet and your Top mention.
✨ Bonus: Twitter Analytics: 5 ways to deliver better insights for quality decisions
In this dashboard, Twitter will show data for a maximum of 3,200 Tweets as well as a breakdown of the impressions and engagement for each. You can also click on a specific Tweet to analyze its performance more closely. Here, you’ll see an Engagement rate tab, which offers a percentage of overall engagement using the formula we mentioned previously.
You can export this data into a spreadsheet via Excel or Google Sheets by clicking the Export data button in the top-right corner.
Tracking your average Twitter engagement rate via a third-party social media management tool
Alternatively, you can use a social media management tool like Sociality.io to continuously track your average Twitter engagement rate. To find your average Twitter engagement rate on Sociality.io, log into your account and head to the Analytics tab. At the top of the page, under Pages, select your Twitter account. Next, set your desired date range, with some of the preset options being the last seven days, the last 30 days, last month, and this year. To generate a summary of your data, click Apply.

Once you do, Sociality.io will generate your social media metrics within that date range, including followers, Tweets, impressions, and of course, engagement rate (marked as ER per tweet).

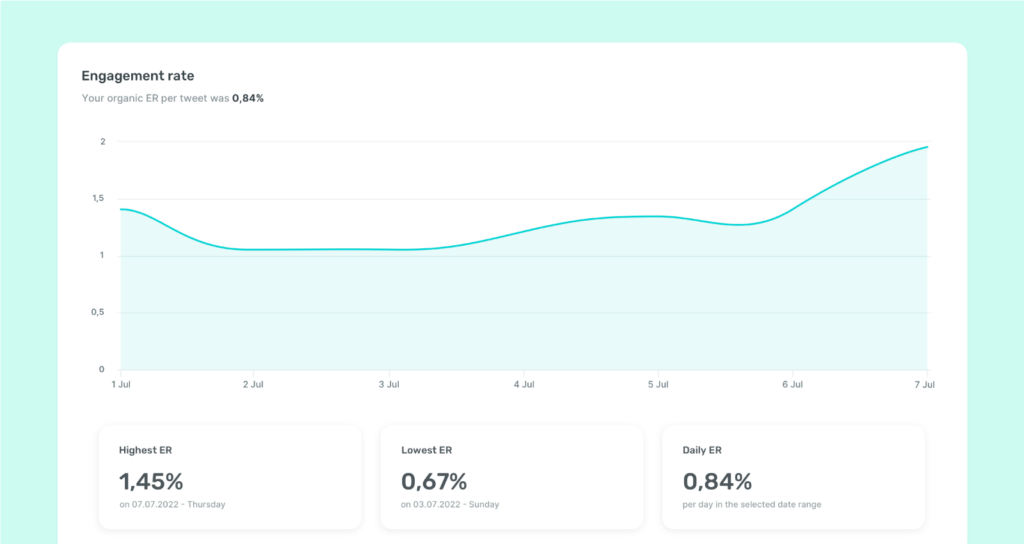
You can also scroll down for more detailed insights into your engagement rate. In this section, you’ll see a breakdown of your average Twitter engagement rate, including your highest engagement rate, your lowest engagement rate, and your daily engagement rate.
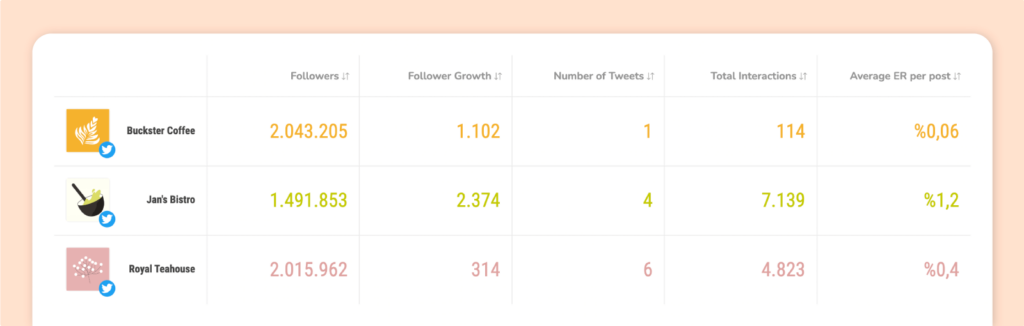
Sociality.io even goes one step further to support users in competitor benchmarking through the Competitor Analysis tab. Much like the Analytics section, you can select your Twitter account at the top of the page, select the competitors you’d like to analyze, and set your date range. Click Create, and Sociality.io will generate a competitor analysis.

In this report, you’ll see the social media metrics of your competitors’ Twitter accounts, including the engagement rate per post in the far-right column. By gaining insight into your competitors’ average Twitter engagement rate, you’ll be better able to set accurate Twitter benchmarks and assess how you compare to other actors in your industry.
Five ways to grow your average Twitter engagement rate
Now that you understand the ins and outs of engagement rates on Twitter, you may be wondering how to boost yours. Below, we offer our top five tips for doing just that.
1. Lead by example: Engage
It may sound obvious, but the importance of this trick can’t be understated: if you want users to engage with you, engage with them. Mention your stakeholders by tagging their username in a tweet, like and Retweet content that aligns with your brand values, and reply to comments on your own Tweets.
With the help of the Engage module on Sociality.io, engagement like this has never been easier. The module features tools that facilitate online interaction, including customer profiles and reply templates. You can even assign tasks to specific team members to optimize your engagement initiatives.

2. Conduct regular Twitter audits
Twitter audits are extremely valuable in increasing your engagement rate on Twitter. A Twitter audit is an in-depth check of your account to find potential issues and asses what is and isn’t working. You can conduct a Twitter audit of your whole profile, your Tweets, and your followers.
A follower Twitter audit is an excellent tool to understand your engagement level better and who is interacting with your content. On the other hand, a Twitter audit of your Tweets is a great way of discovering what content is receiving high levels of engagement and what content isn’t.
3. Run an Engagement campaign
Through Twitter Ads, you can run various types of campaigns with different campaign objectives, including Engagement. An Engagement campaign places your name and products/services in front of your audience, thereby raising awareness, sparking conversations, and boosting engagement metrics.
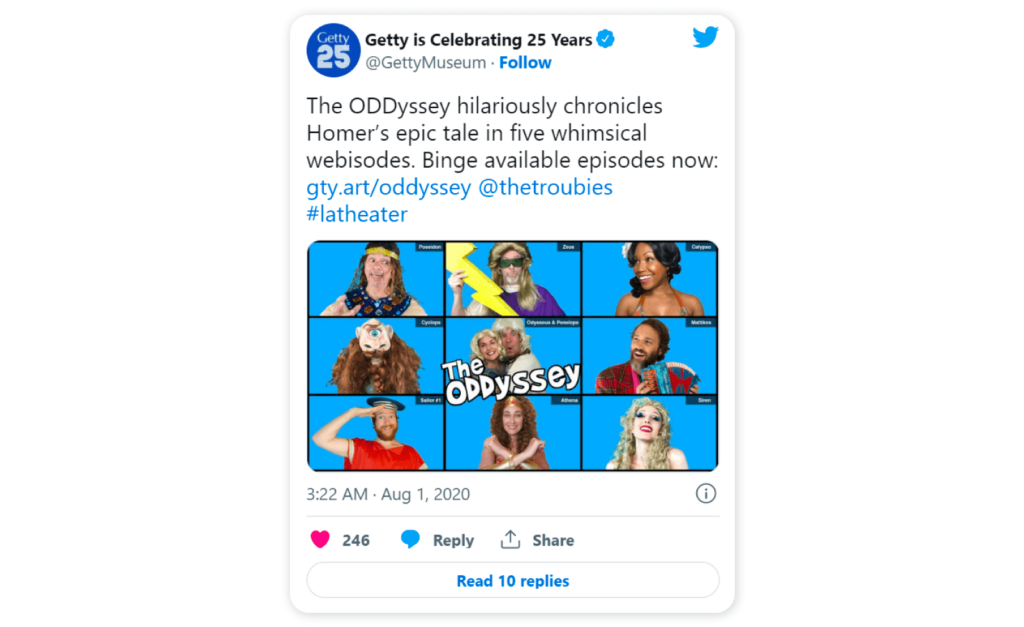
Below, you can see an example Tweet from an Engagement campaign for Getty Museum, which garnered over 65,000 engagements. Learn more about the campaign and its performance here.
✨ Bonus: Twitter Ads guide for beginners
4. Embrace visual content
When it comes to spiking engagement, visual content is a social media marketer’s best friend. Twitter reports that users are three times more likely to engage with Tweets that showcase visual content, such as images, GIFs, or videos. Experiment with a variety of visual posts to see what resonates the most with your audience.
5. Prompt engagement in your copy
If you want people to engage with your Tweets, tell them that. Integrate engagement prompts directly into your copy, such as asking questions, encouraging users to share their thoughts on a particular topic, or launching a giveaway in which users need to like your Tweet to be eligible entrants.