
How to calculate engagement rate on social media?
Summarize this article via
Remember the days when metrics like followers, likes, and impressions were the be-all and end-all? Well, those days are gone. Sort of.
Sure, these metrics still count for something, but what do they really tell you about your social media performance? Not as much as you’d think.
Engagement rates are the real litmus paper when it comes to measuring your social media marketing prowess. Who’s sharing your posts? How many people are leaving comments?
That’s why engagement is the metric du jour for gauging the ROI on your latest social media campaign. Or when your business is scouting for influencers.
The bottom line is that engagement is the most valuable currency and the only true test of social media success.
This article breaks down how to manually and automatically calculate social media engagement rates.
What is engagement rate?
The engagement rate calculates the level of interaction your brand’s social media content garners in relation to your audience size and reach.
While likes, views, and impressions certainly count as engagement, they tend to be passive. Engagement is usually seen as active interactions, such as comments, shares, saves, mentions, and direct messages.
There are different ways to measure engagement rates, depending on your objectives, social media strategy, and chosen platforms.
Why track engagement rates?
Gaining new followers is great. But it won’t do much for your brand if your new audience doesn’t connect with your content.
At the end of the day, your content needs to resonate with your audience if you want to drive sales, brand awareness, and growth. The best way to gauge whether your audience cares about your content is by tracking how many comments, shares, saves and likes it receives.
Key engagement metrics
We’ve already included some of the main engagement metrics your social media team needs to track, but here’s a more exhaustive list.
You should factor some (or all) of these metrics into your engagement rate formula:
- Branded hashtags
- Brand mentions
- Clicks
- Click-throughs
- Comments
- Direct messages
- Likes
- Profile views
- Reactions
- Replies
- Retweets/regrams
- Saves
- Shares
If you’re getting high numbers of these metrics, chances are you’re doing something right.
4 ways to manually calculate engagement rate
Here are four common ways to calculate engagement rates on social media.
1. Engagement rate by reach (ERR)
Let’s start with the most common way to measure social media engagement–ERR.
ERR calculates the total percentage of users who interacted with your content after seeing it. It can be calculated for a single post:
| ERR = Total engagements per post/reach per post x 100 |
Alternatively, it can be used to calculate the average engagement across multiple posts. Simply tally all the ERRs from the posts you want to include and divide the total by the number of posts:
| Average ERR = Toral ERR/Total posts |
Calculating ERR is a popular method because it tends to be more accurate. After all, your followers won’t see all of your posts, and some users who aren’t your followers will see your content.
On the other side of the coin, it’s worth remembering that reach is a tricky variable to control. If your brand has a low reach, you may wind up with an extremely high engagement rate which may not give you the most accurate depiction of the post’s success.
2. Engagement rate by views (ER views)
Video reigns supreme these days. So, if the majority of your brand’s content is video, you will want to know how many viewers are engaging with your videos. This is known as ER views.
You can calculate this per video:
| ER view = Total engagements per video / Total video views x 100 |
Or, you can work out an average ER view based on a number of videos:
| Average ER view = Total ER views/Total video posts |
ER views are a fantastic way to gauge how much engagement your videos are garnering. That said, it’s important to remember that the total number of views usually includes repeat views from the same user.
Just because the user watched the video more than once doesn’t necessarily mean they engaged with it all of those times.
3. Engagement rate by posts (ER post)
This is a favorite amongst social media influencers. Similar to ERR, ER measures the overall engagement rate on a specific post.
However, it differs from ERR because rather than focusing on reach, it looks at the rate at which your followers engage with your post.
You can calculate the ER per post:
| ER = Total number of post engagements/Total followers x 100 |
Or, you can calculate the average ER by adding up the ER on a selection of posts and dividing the total by the number of posts:
| Average ER = Total ER per post/Total posts |
As we mentioned in the ERR section, reach is a hard metric to control. Swapping reach for the number of followers makes ER a more reliable way to measure the success of a specific post or group of posts.
Since ER doesn’t factor in reach, we recommend comparing ER with other growth analytics for a full picture of your engagement efforts.
4. Engagement rate by impressions (ER impressions)
If you’ve got a social media strategy in place, you’re probably using paid ads. ER impression is a great metric to track the success of those ads in terms of engagement.
Unlike reach, which tracks how many users see your social media content, impressions measure how many times your content appears on a user’s screen.
Bonus read 👉 What’s more important: Reach vs. impressions?
Here’s how to figure out ER impressions:
| ER impressions = Total post engagements/Total post impressions x 100 |
If you want to work out the average ER impressions across multiple posts, you simply add up the total number of ER impressions for each post and divide by the total number of posts:
| Average ER impressions = Total ER impressions/Total posts |
There’s no doubt that this is a handy metric to track, especially if you want to measure the engagement of paid content based on impressions. But, it should not be used alone.
Impressions aren’t the most stable metric, and the overall engagement is likely to be lower than with other metrics on this list. So, while it’s certainly valuable, it works best in conjunction with other social media metrics.
Best way to calculate engagement rate
Even with an engagement rate calculator, working rates out manually can be time-consuming and headache-inducing.
Fortunately, you don’t have to be an expert social media analyst to work out engagement rates (although having one on your team certainly helps).
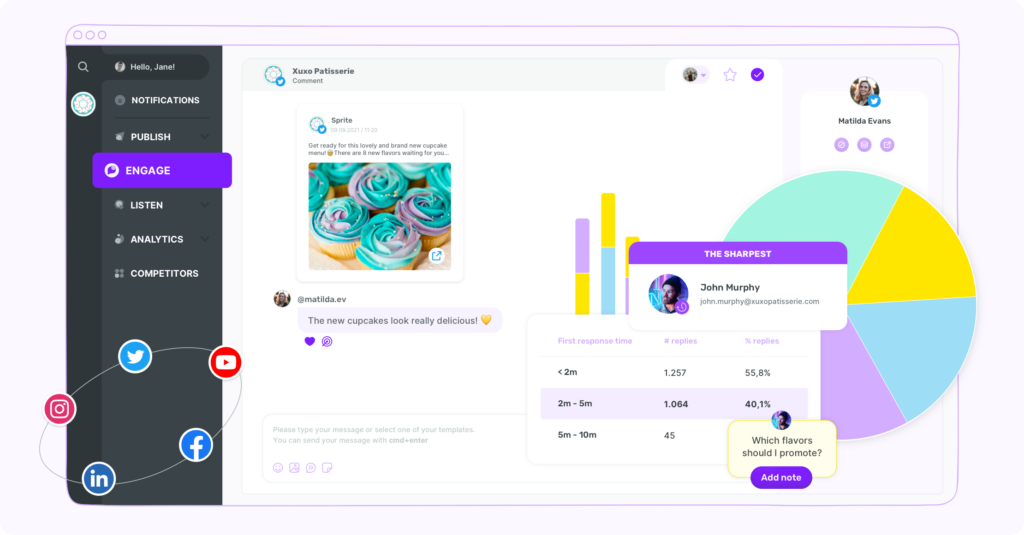
Social media management tools, such as Sociality.io, can do it all for you automatically. You can pull a customized social media report that visualizes all key engagement metrics in just one click.
This is how your engagement data will look in Sociality.io:
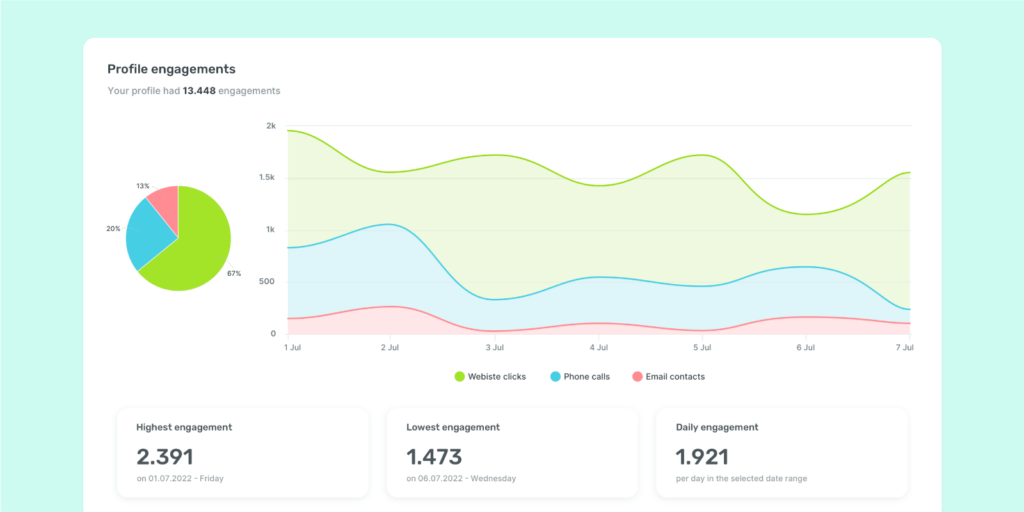
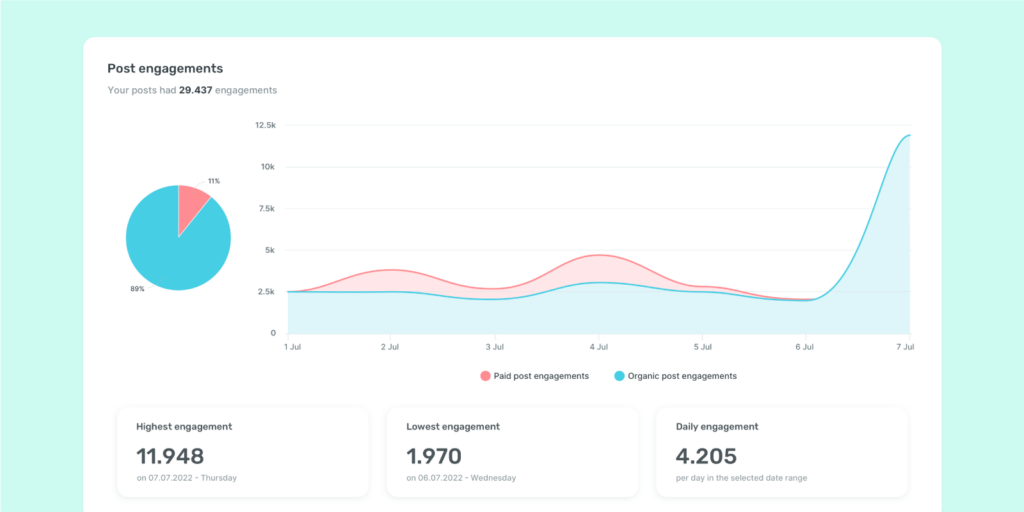
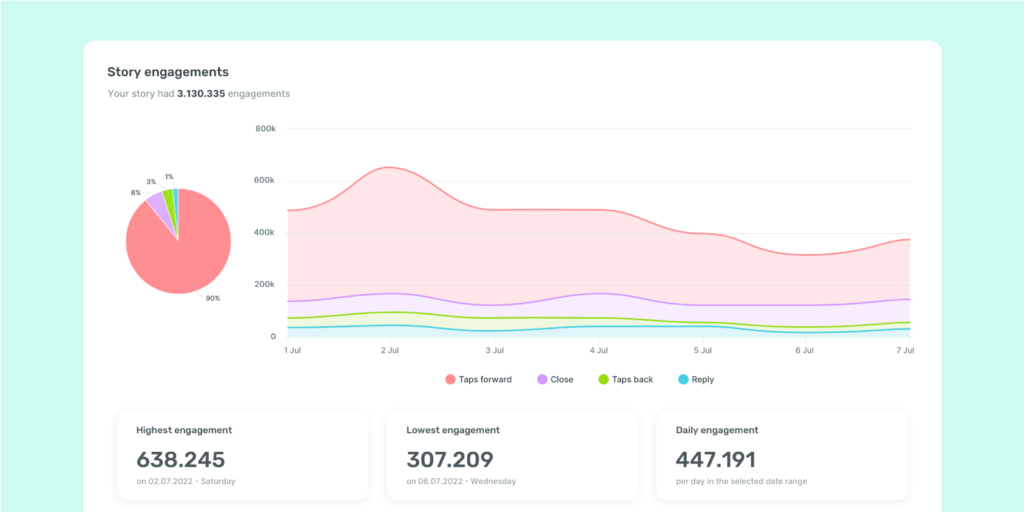
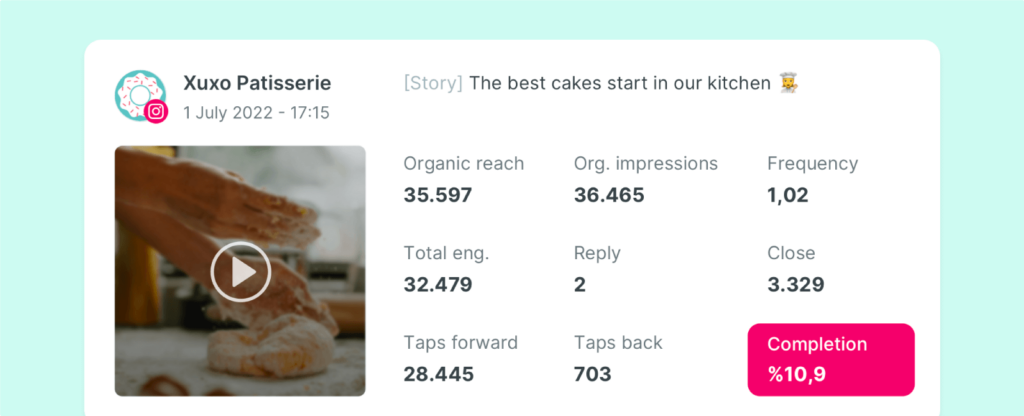
Sociality.io comes with powerful social media analytics so you can calculate your engagement for every post or track your overall performance from a high level. That way, you can see the types of posts that garner high engagement rates and tweak your strategy to add more of those.
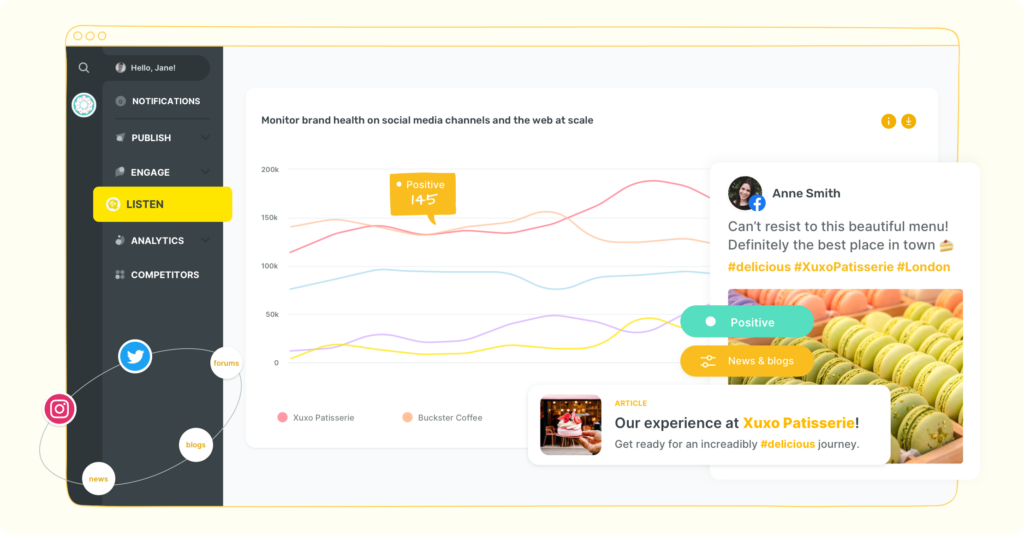
You can extract valuable social media insights to see where you’re garnering high engagement and where you’re falling down.
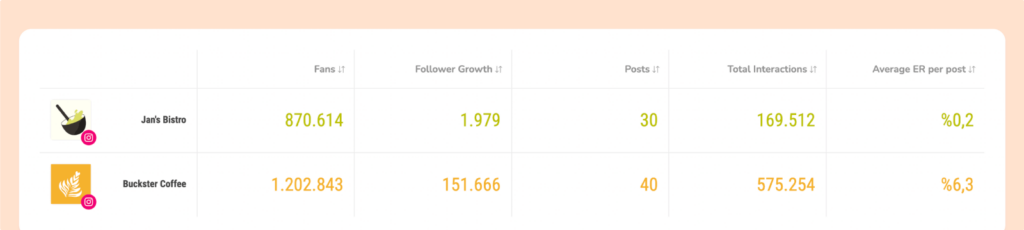
Success is relative. Competitor benchmarking is a powerful way to see how your engagement rate stacks up against your competitors and the top industry leaders.
Sociality.io’s Competitor Analysis tool makes it easy to benchmark your competitors’ engagement rates.
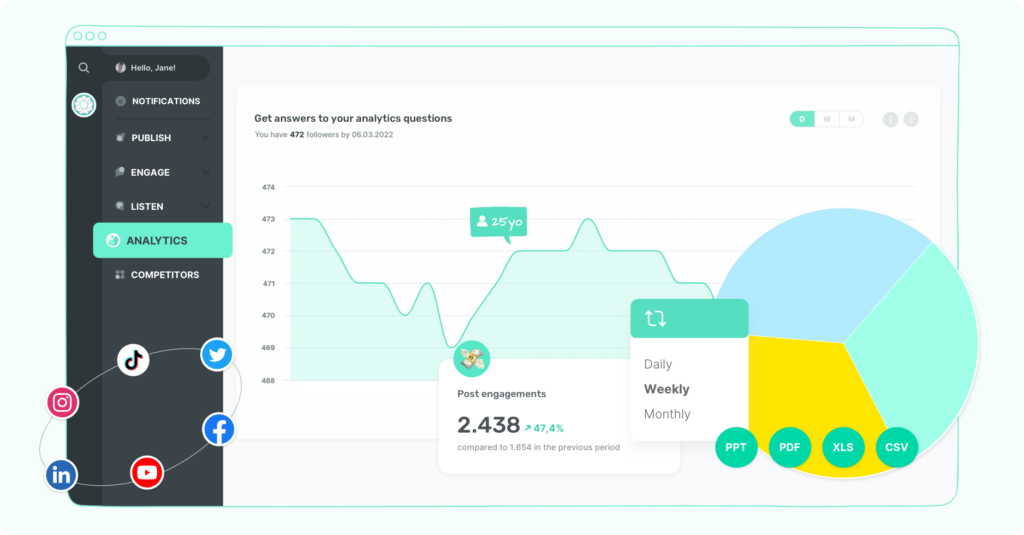
The Analytics module allows you to track essential social media metrics on all your posts across multiple platforms.
Worth a read 👉 What is KPI reporting?
With a goldmine of data at your fingertips, you can check your engagement rate over a specific time period and compare the results to previous social media campaigns.
The more you engage with these analytics, the better your social media performance will be. So, stay in the loop by scheduling reports to be automatically created and sent to your team.
What is a good engagement rate?
You’re probably wondering what’s considered a ‘good’ engagement rate.
While the goalposts may shift depending on the size of your audience, most social media marketing experts agree that somewhere between 1% and 5% is good.
Don’t worry if you’re outside those magic numbers, though. The bigger the following, the harder it is to hit a high engagement rate.
Consistency is key. With constant monitoring, benchmarking, and pivoting, your engagement will be through the roof before you know it.
In closing…
That’s everything you need to know about how to measure your brand’s social media engagement. We hope it helps.
Sociality.io can give you the tools to track and boost your engagement rate at scale (no calculators necessary). Start your free trial today.