Collect meaningful data for a better ROI using Sociality.io Analytics Module
Summarize this article via
Results.
That’s the name of the game when it comes to social media marketing.
And all your efforts so far have been aimed at getting better results from your campaigns: greater brand recognition, a larger and engaged following, more signups, and more sales.
In short, you’re trying to get a return on investment that’s meaningful for your business.
But is it working?
If you’re trying to figure out the exact areas where you’re falling short or trying to build on top of the gains you’re already seeing, it’s time to look deeper into your social media data.
Come along.
What is social media data?
Social media data refers to raw information on how users view the content you post, and the ways in which they’re engaging with your content and sharing it. That includes users’ perceptions and actions as far as all your profiles and channels, and how those are changing over time.
This data can be split into two categories: quantitative and qualitative.
Your quantitative data answers the question, “how many?”
It’s used for metrics you can assign a hard number to, such as:
- Followers
- Likes
- Comments
- Shares
- Video views
- Conversions
- Reach
Your qualitative data, meanwhile, tells you “what kind.”
It gives you insight into things like the demographics of your followers (gender, age, location), the sentiments people are expressing towards your brand (positive, negative, neutral), or who your most active followers are.
Why you should collect social media data
With access to effective social media reporting, each decision you make can be more focused and better-informed than the last.
You can achieve iterative growth, and act with the clarity that enables repeatable success.
Not something to leave on the table, is it?
More concretely, you can…
1. See where you’re going wrong
A study by Gartner reveals that 76% of the top-performing marketers are basing their decisions on data.
Your social media strategy shouldn’t be any different. Let data show you the patterns you’re missing.
It could be as simple as posting at the wrong time. After all, research by Harvard Business Review showed that brands could boost ROI by 8% simply through matching posting schedules with target audiences’ sleep-wake cycles.
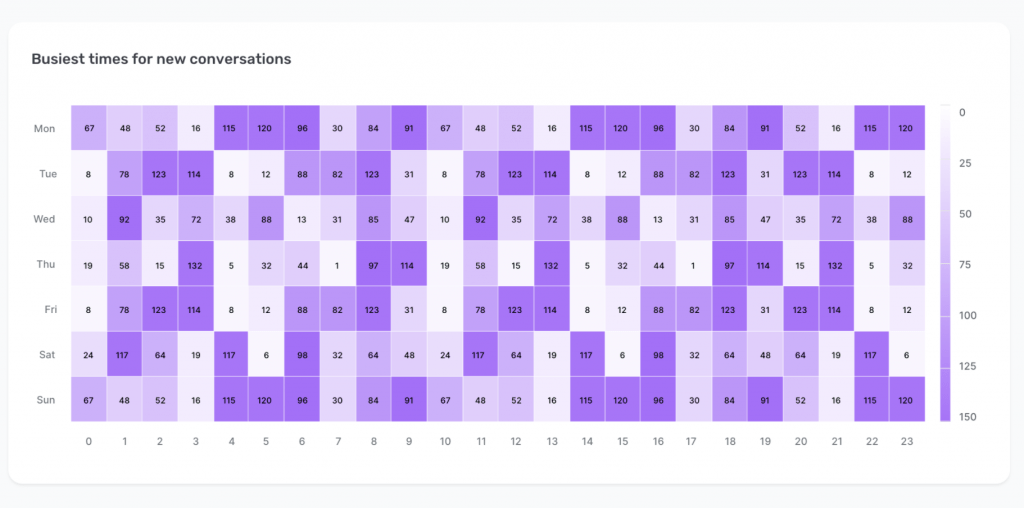
Similarly, Sociality.io lets you see users’ most active hours so you can recognize peak periods and schedule accordingly.
2. See what you’re doing right
Chances are there’s something you’re doing right and you don’t even know it.
Collecting social media data can help you realize those things you’re nailing, so you can double down on them and get even better results.
You’ll also avoid the risk of attributing your good returns to something else entirely, which, according to Marketing Evolution, affects 56% of marketers.
Once you sort posts in either descending or ascending order for the metric you’re trying to boost, you can easily see both high-performing and low-performing posts.
That makes it easier to spot patterns worth continuing and those that you need to drop.
What social media data should you focus on?
Sociality.io’s Analytics module gives you access to a comprehensive dataset.
The more you have, the more you can pick from!
But you also don’t want to overwhelm yourself or end up paying attention to data that can’t really help your campaigns.
So right now we’ll touch on narrowing that down to what’s relevant to you at any given time.
1. Match your data points with your KPIs
At the start of each campaign, you have clearly defined goals you’re trying to achieve. And you measure them against your key performance indicators (KPIs).
If you’re a little fuzzy on that, this guide on setting and tracking KPIs can give you a refresher.
The point is to align the information you collect with your KPIs, so each data point contributes to you getting a better understanding of how close you’ve come to achieving the aims of the campaign.
2. Reconcile the data points with your broader business goals
What’s topping the priority list for your business right now?
Whether it’s generating leads, improving customer support, or letting people know about an exciting new change you’re rolling out, your social media strategy can play a role in helping you meet that goal.
You can focus on collecting social media data that correlates with the overall business goals you’ve set.
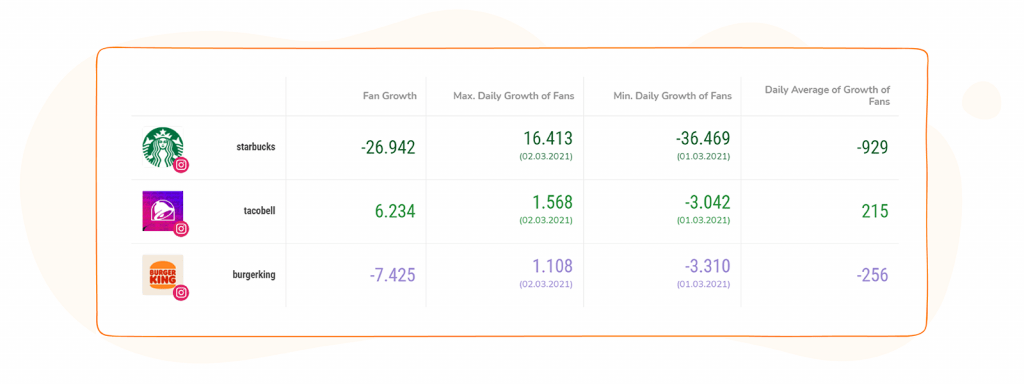
3. See what’s working for your competitors (And what isn’t)
Sociality.io lets you venture behind enemy lines, giving you insights into what your competitors are up to and how it’s working out for them.
Maybe there’s something you missed about your target audience that someone else is exploiting. Or perhaps your social media strategy doesn’t factor in ideas you could be trying out.
4. Evaluate your conversation skills
Your social media presence creates a two-way street. You’re not just posting at your audience. They’re able to talk to you too.
What are they saying?
And how good have you been at responding?
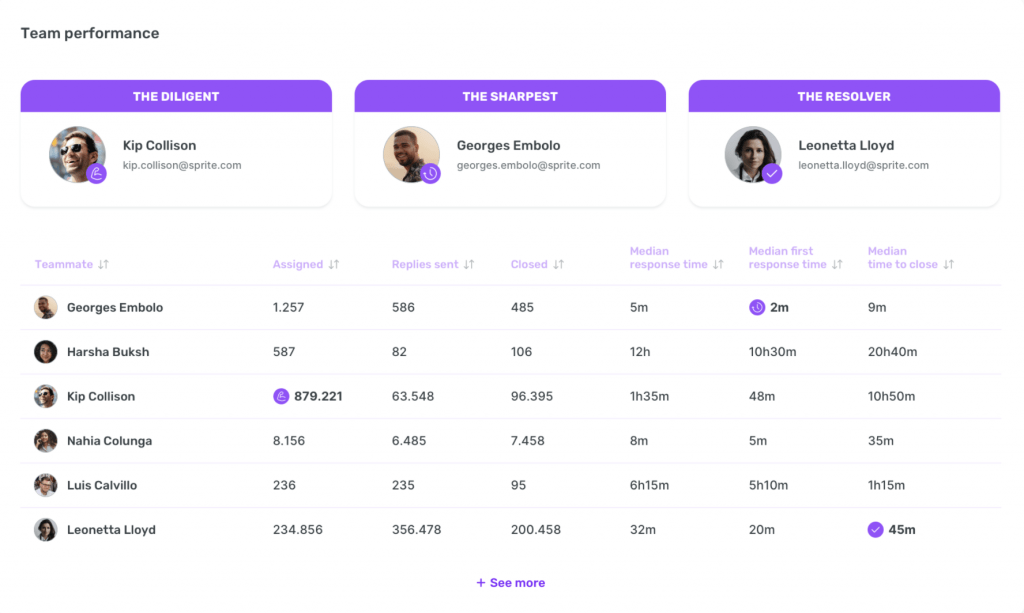
There’s a lot of data you can collect here.
You can see the peak hours when people are starting conversations with your brand—which may also be the time to be more focused on customer service.
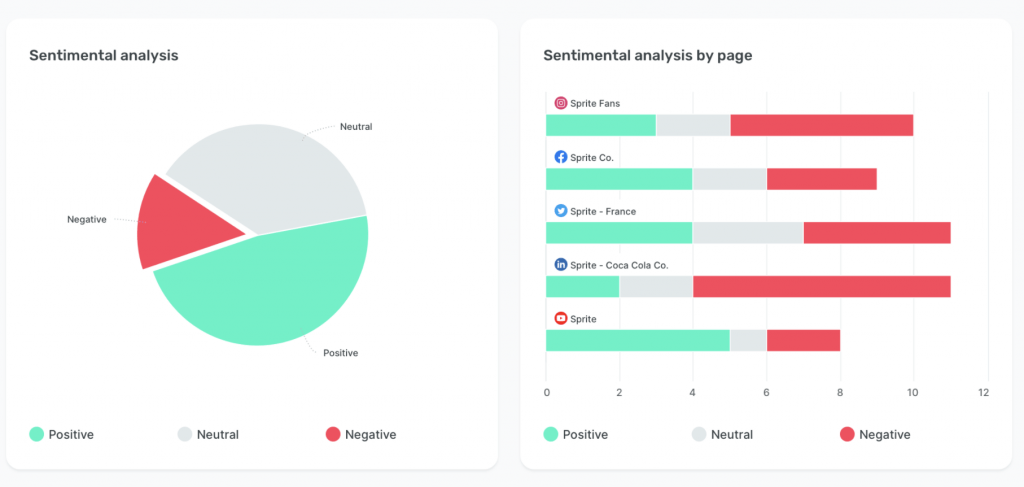
And you can see the sentiments behind each conversation, giving you a heads up on the health of your brand, and whether it’s time for a campaign to make your audience warmer to you.
Meaningful data for each platform
Remember, the point of gathering data is to glean specific insights from it.
There are certain metrics that you’ll be interested in across all your platforms.
Overall, you’ll want to know about factors such as:
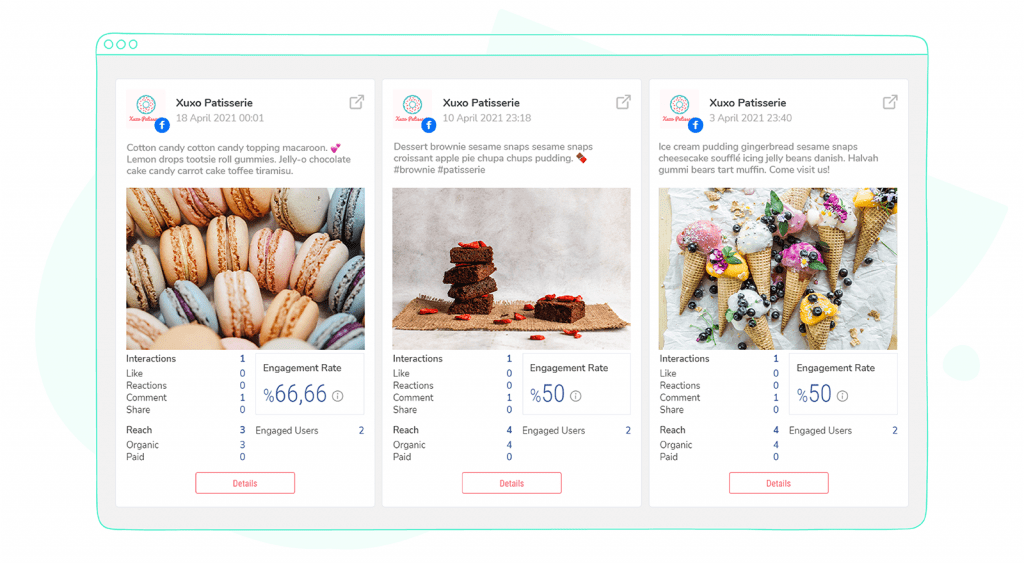
- Reach and impressions
- Engagement rate
- Distribution of fans
- Influencer engagement
- User activity hours
But by looking at the platforms individually, we can spotlight features presented by the Sociality.io Analytics module for each of them.
So let’s drill down on each one, focusing on some platform-specific data points you can analyze to boost your ROI.
Before go deep, it is worth checking 👉 How to define and measure social media ROI for your business
Facebook Business
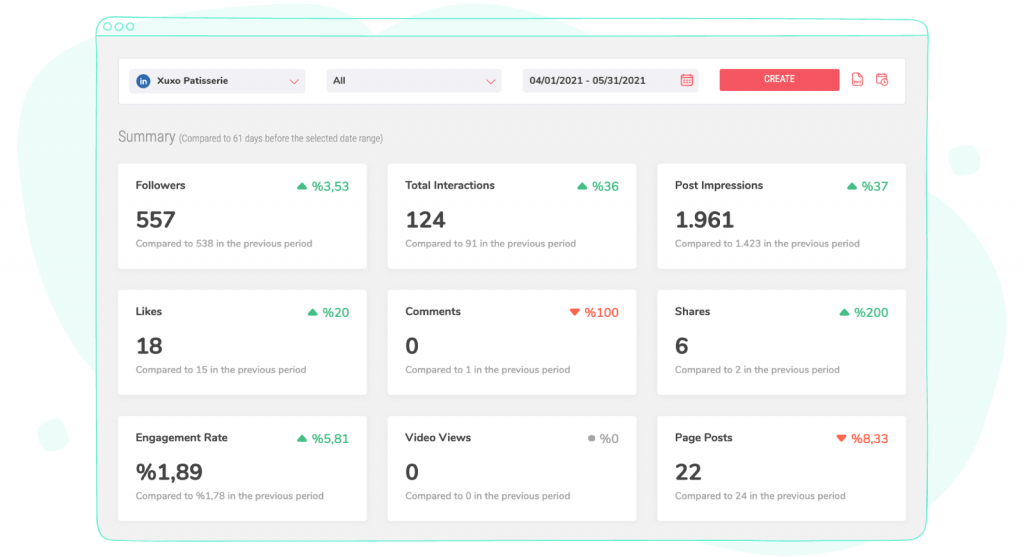
You can track fan, reach, engagement, and video.
If you’re running ads along with your organic campaigns, Sociality.io lets you see the source of your likes, so you can differentiate between results from either avenue.
And you can see reach and impression rates for the page as well for individual posts.
You’re able to see demographic details about your fans, such as their gender, where they live and the language they speak, helping you to understand your fanbase at a deeper level.
For your videos, you can tell between those that auto-played and the ones users clicked on to view.
You can also identify your most active fans, helping you to refine your picture of your target audience.
Instagram Business
You can track followers, engagement, and stories.
Are Instagram stories a key part of your strategy?
Then you can benefit from insights on how well your stories are connecting with your audience.
One-third of the most viewed Instagram stories are from businesses, so sharpening your strategy can offer huge returns.
The Analytics module gives you a clear idea of the reactions each story panel is receiving from your audience.
You can see how many people are watching each story all the way through, as well as those who are tapping forward, tapping back and exiting (swiping upward). You can track the rate of replies, too.
If you have multiple panels at once, for example, a forward tap isn’t so bad since the user is still interested in interacting with your brand. An exit, on the other hand, can mean the sequence of stories has failed to engage.
LinkedIn Business
You can track followers and engagement.
You might be focusing some of your marketing efforts on LinkedIn, like 79% of marketers.
In which case, you’ll find many of the insights provided by the Sociality.io Analytics module useful.
Depending on your brand and target audience on LinkedIn, there are probably a few questions you’re asking yourself.
“Is my strategy resonating with people in the industries I’m targeting?”
“And, as my follower base increases, is it made up of the decision-makers in companies, who can go on to be my customers?”
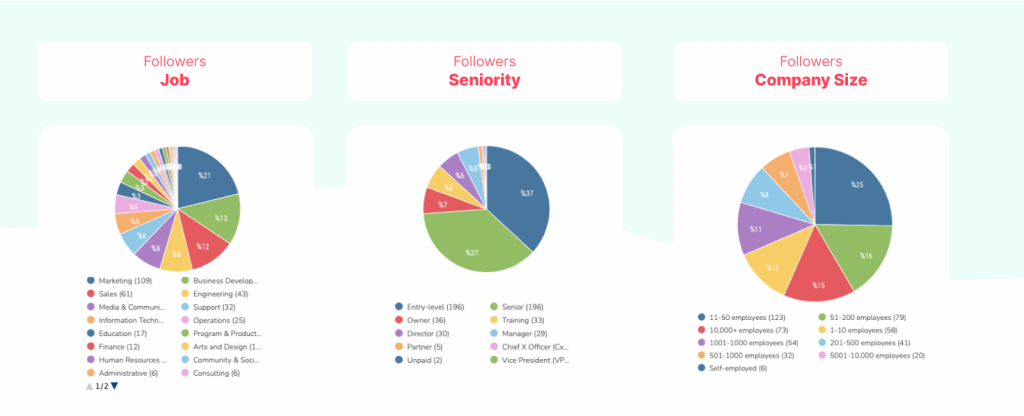
You can answer these and other questions with detailed reports, helping you to shape a strategy that connects with the audience profile you’re aiming for.
You can track followers and engagement.
On Twitter, you can keep track of quantitative measures such as mentions and retweets, along with the types of tweets that are attracting the most engagement—and how that’s contributing to the overall growth of your account.
As with all other platforms, you also get access to your engagement levels and the sentiments people are expressing towards your brand, helping you to stay informed on your brand’s health and ways to boost it.
YouTube
You can track subscribers and engagement.
You can see how each video is performing, in terms of comments, likes, and unlikes.
You’re also able to learn in-depth details about your subscribers and the rate at which they’re growing.
Plus, you can find out who the most active ones are, and how many times they’re interacting with your channel and your content.
All that feeds into your engagement rate, which lets you see if your videos are resonating with your audience.
And, if not, what you can do about it.
Bonus: Learn how to grow your subscribers on YouTube without buying subscribers from here now.
Tips for capitalizing on the social media data you collect with Sociality.io
1. Create reports as often as you want
Unlike native apps, Sociality.io doesn’t place any limits on the number of reports you can generate.
Whether you’re setting aside time to analyze your social media strategy once a month, once a week, or even daily, you can get reports that match your preferred time frame.
Plainly, you have access to crucial information and insights on demand.
2. Get reports sent to you automatically
Beyond the ease and convenience of being able to generate reports whenever you like, you can simply have them delivered to you.
You have the option to schedule when you’d like to receive reports in your inbox, and you can set the frequency from daily to quarterly.
One less thing to keep on your to-do list!
3. Export and share
Maybe you’d like to compile your reports or share them with other people on your social media team so they can also give their input.
You have the option to export them for those purposes and more. You can do so in Excel, PPT, and PDF formats for maximum flexibility.
4. Personalize your reports
Go ahead and make your reports truly yours.
If you’re showing them to someone on your team, add your logo for a little more of that professional touch.
You can apply your own color scheme, too.
Nothing beats social media data when it comes to iterating your campaigns, making each post more resonant than the last.
Without gathering it and drawing relevant insights, you’re essentially blindfolded.
But once you’re making good use of your reports, you can start boosting your ROI, so each move you make creates a greater impact and provides a better return.
Now start looking through those detailed reports and using them to get supercharged results!