Summarize this article via
Although almost everyone uses social media platforms, not everyone understands a world of social data that hides behind posts, videos, comments, and search bars. This data is split into various categories called “social media metrics”. Let’s breach the gap and logically connect things.
What are social media metrics?
Social media metrics refer to data that measures the impact of your social media activity on your marketing performance. The metrics provide meaningful information and help you direct your marketing department and the business to its objectives. They help identify how successfully you are running social media campaigns and where you should modify them. Moreover, in order to achieve a particular social media goal, a related metric helps determine your social strategy and further actions.
Usually, social media metrics fall into the category of vanity metrics, and thus are often overlooked. Many times C-level management is not interested in followers count or recent campaigns’ cost per click. However, it is possible to intelligently analyze metrics’ correlation and causation with the bottom line and discover the ones that actually drive business results.
Related article: Introducing a better way to prepare and explain social media reports to c-levels
What role metrics play in your business?
In essence, metrics turn large data into well-formulated statements. Thus, you have a systematic and defined way of collecting and analyzing all sorts of information and gaining value from it.
Note, that having a clear picture of what result you want to end up with is crucial. Below we illustrate some generalized examples on how metric and goals are correlated:
- Growing the number of people your brand can reach (audience): Say your brand has a YouTube channel with 100 subscribers. Let’s assume that ten people out of this hundred are very likely to open your website and purchase whatever product you’re offering. We can conclude that 10% of the channel audience are potential customers. But what if you had 1000 subscribers? 10000? You orient your attention on metrics.
- Increase your brand’s recognizability (awareness): It often happens, when two competing companies have similar products: Apple and Samsung, Pepsi and Coca-Cola etc. Have you ever wondered what guides a customer to choose one brand over the other when he sees their similar products placed right next to each other in a store? It’s brand awareness and a lasting feeling that one is more unique or authentic than the other. It makes companies create symbolic media assets that build people’s associations. And for that, companies rely on metrics that present people’s opinion about their brands.
- Earning people’s trust: Customer trust can significantly impact your brand reputation. To earn people’s trust you should show the human side of your business. A company stands out when it allows every consumer to ask the brand a question and get it answered shortly. It presents the human side of a company. So be a company that not only publishes official statements to its shareholders and the press but one that is able to speak to and hear from the common folk. And for that you’ll need to track customer experience metrics.
- Generate Leads and Sales: Not all of your subscribers are your potential customers, a huge portion of them are very unlikely to purchase your product. How do you lower that amount? How do you get them to buy more? Track people’s opinions via metrics and adjust your marketing.
Once you have your goals figured out, it’s time to meet your audience. Different people constitute your audience. Each platform occupies its own niche, and what works for one might have an opposite effect on the other. You’ll need some more analysis to understand your social media audiences better.
The most important social media metrics
Reach
This metric gauges the spread of your content to the most current time and foresees the likelihood of it ending up in the feed of a potential customer.

Engagement rate
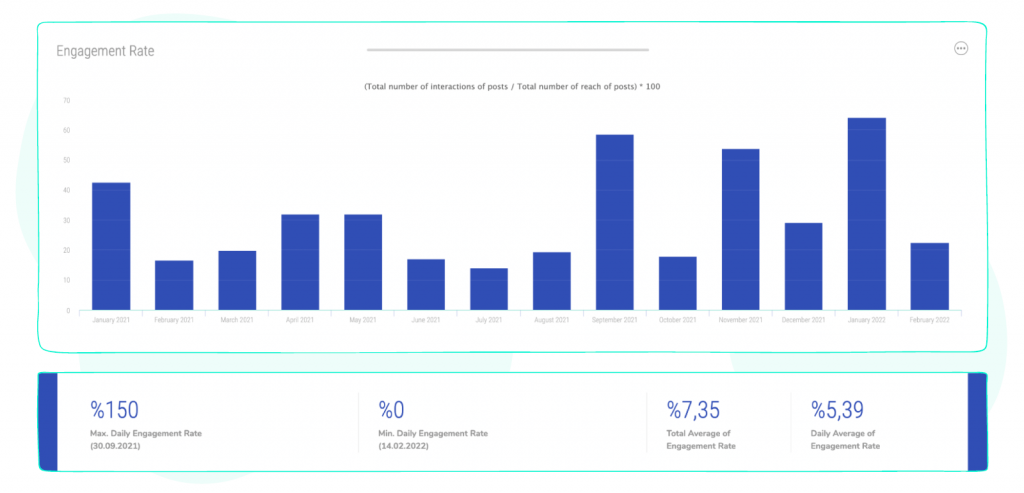
- Engagement rate by Impressions (ER impressions)
Total engagements per post / Total impressions = ER impressions
Total ER impressions / Total posts = Average ER impressions
The first option suggests dividing the total number of interactions by the number of impressions. This way tracks how frequently certain content appears on a screen of users. This formula applies when you’re running paid content and want to evaluate the effectiveness based on impressions.
- Engagement rate by reach (ERR)
Total engagements per post / reach per post = ERR
Total ERR / Total posts = Average ERR
This is another common way to measure the percentage of people who interact with your content after seeing it. This formula provides a more accurate metric since people may be exposed to your content via shares, hashtags, etc. The first formula calculates ER for a single post, and the second one measures the average rate for multiple posts.
Interaction Rate (IR)
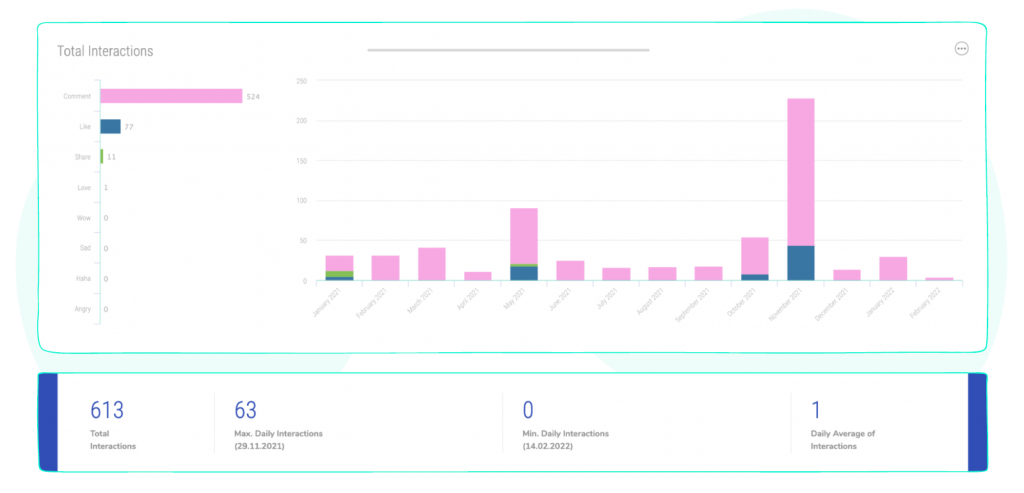
This crucial metric tracks how people respond to your social media content. It evaluates likes, comments, shares, and even clicks to enlarge the images, clicks to play video clips, save to favorites etc. The metric monitors how people’s interactions evolve over time and helps to understand how changing trends impact your social media accomplishment.
You can measure it via this formula:
Interactions / Reached users = Interaction Rate
Cost per conversion
Click Count
The metric highlights the exact content that encourages activity by your audience. The name gives it all; it’s the number of clicks a particular post or a campaign gets.
Audience’s Sentiment

Impressions

This metric refers to the count of how many times your content has been shown to users. Important to differentiate impressions from reach, which measures unique users who view your content. Impressions metrics count any time the content appears to a user, even if this occurs multiple times. Also, it identifies your followers that haven’t engaged with that content. Thus impressions are a great complementary metric that assures you whether you are on the right track.
Related article: Which is more important: Reach vs. Impressions
Demographics
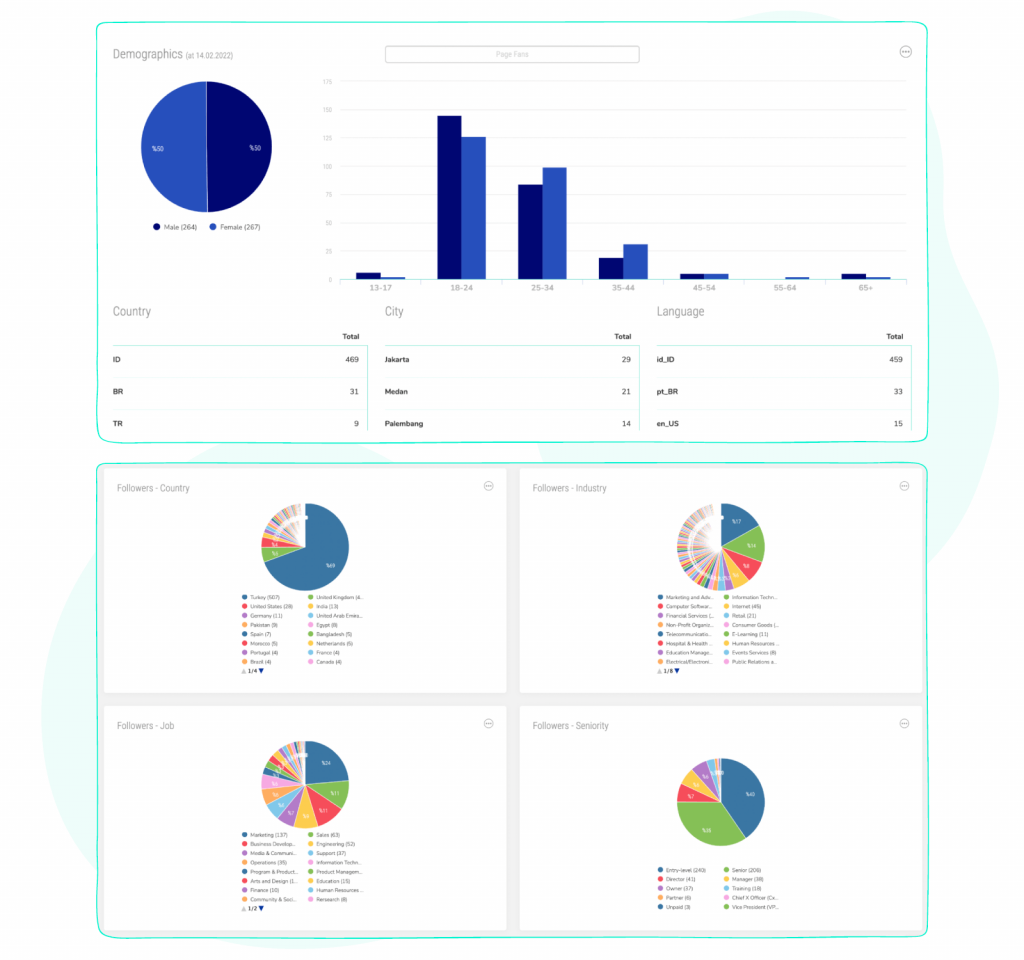
The nature of quantitative metrics
Taking a careful look at the data in numerical values can effectively contribute to achieving the goals of your business. Metrics refer to the qualitative measurement, which is a more nuanced approach to collecting insight on a post-by-post basis. Hence to see the holistic picture of your social media performance requires time. And to interpret metrics accurately you need to establish reporting intervals. Although daily reports might be handy in urgent situations, you should avoid redirecting your extensive marketing strategy based on a daily analysis. To get a clear picture of your performance, you need to observe data over a period of weeks.
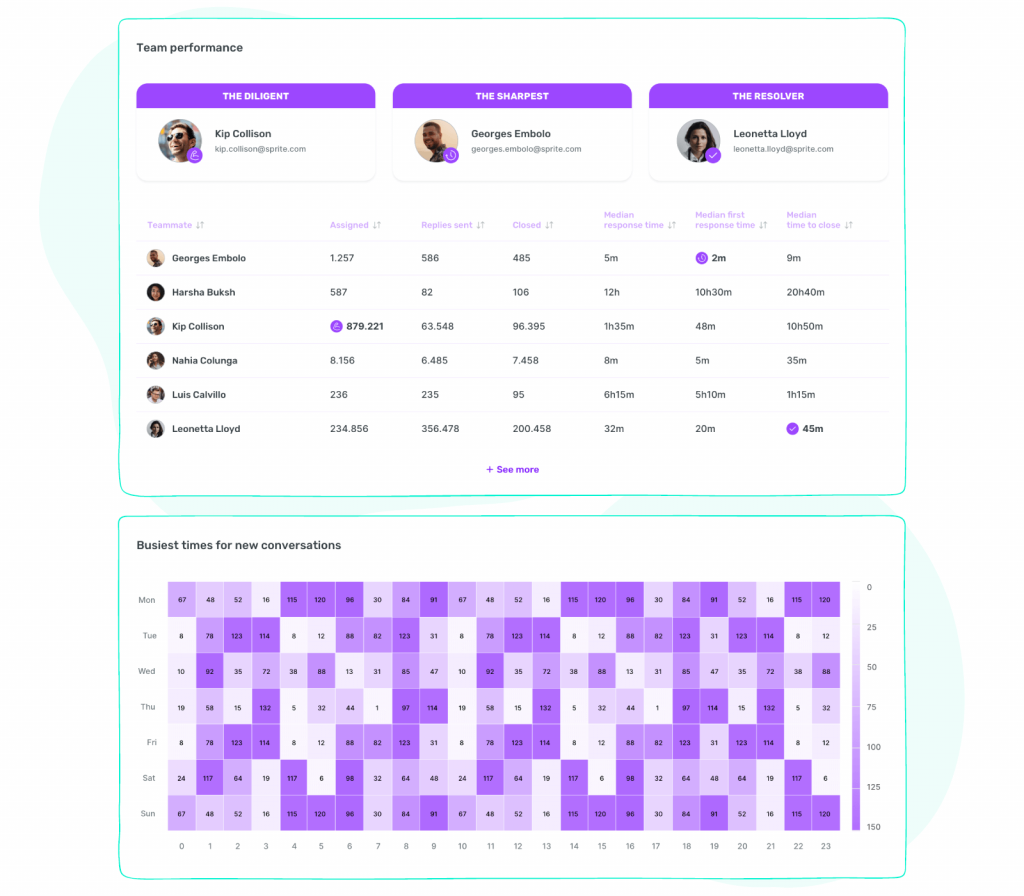
Team performance
We highly suggest evaluating teams’ performance for businesses that maintain crowded teams. Sociality.io’s advanced Engage Module allows you to streamline collaborative work and effectively coordinate your social media engagement. Its Assignment workflow tool enables you to transparently monitor team activities via special logs and helps deliver relevant information and tasks to the appropriate teams.
Team performance reports allow you to answer to the following questions:
- How efficient is your team overall?
- Have there been notable changes in your team’s performance?
- Which teammates are performing best or worst – and why is that?
- How is a specific teammate performing?
Competitor analysis
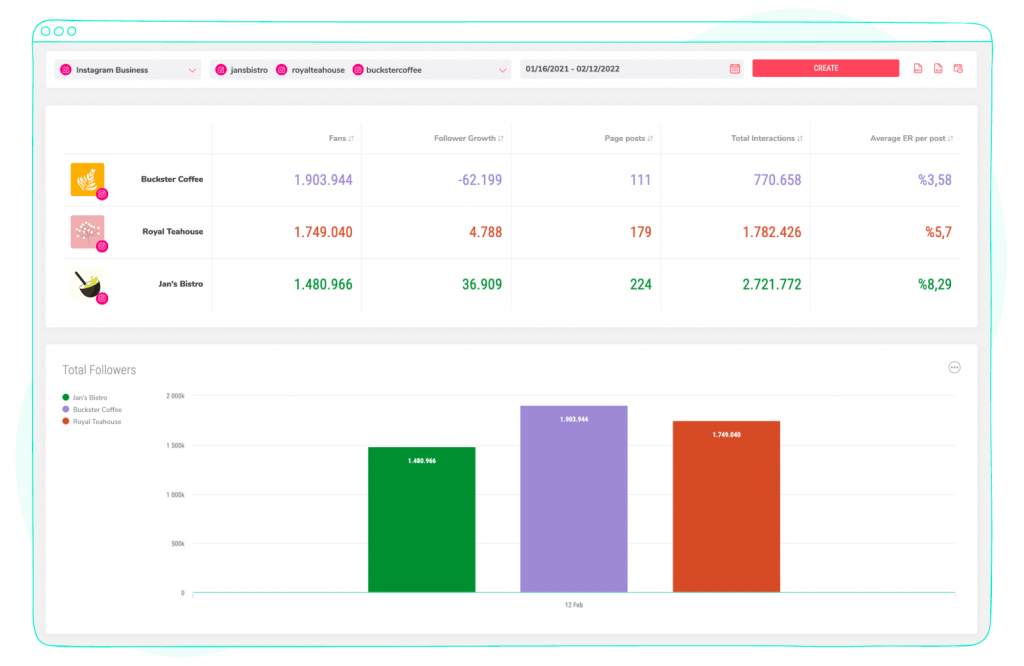
You should analyze your competitors’ performance in order to evaluate your own company’s social media presence. However, to avoid laborious process you’ll need a tool to automate competitors’ historical data gathering. Then the metric presents accurate information of how your market segment functions on digital platforms. You can explore this topic in-depth here.
Where to track social media metrics
Most social media platforms provide their own native analytical tools for tracking various metrics that lend insight into what people feel about your brand. Starting from the average age of your followers and the time when posts reach the most engagement, ending with all sorts of basic metrics like the number of likes a post gets on average. It is worth considering Google Analytics for some social media platforms or opt to use a third-party tool.
Below we are presenting you with instructions on how to track metrics for different social media networks. In addition after each guide we provide a table of the most essential metrics that a particular social media platform allows to monitor.
Facebook and Instagram
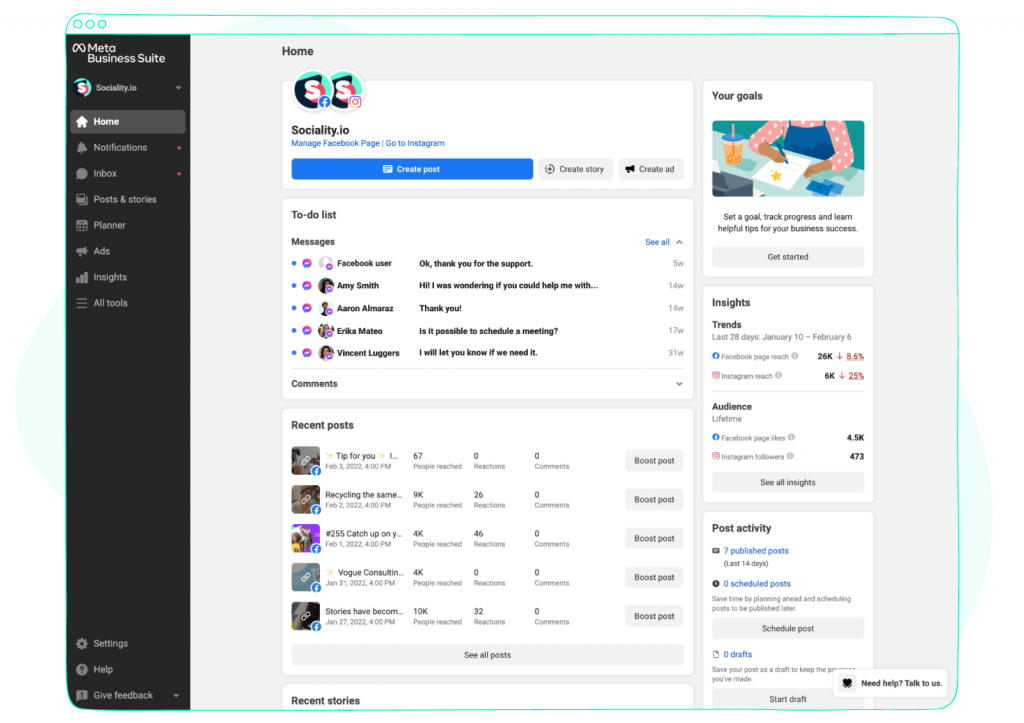
You can track Facebook and Instagram social media metrics using three Facebook in-platform options to access essential data and insights: Meta Business Suite, Audience Insights, Creator Studio.
Meta Business Suite is a solution that manages all your affiliated accounts across Facebook and Instagram. Here, you are offered all the necessary business instruments to coordinate your marketing and advertising activities. It provides you with metrics and reports. In Meta Business Suite’s Insights section, you will find meaningful insights about your overarching performance or precisely for one of the accounts or individual posts.
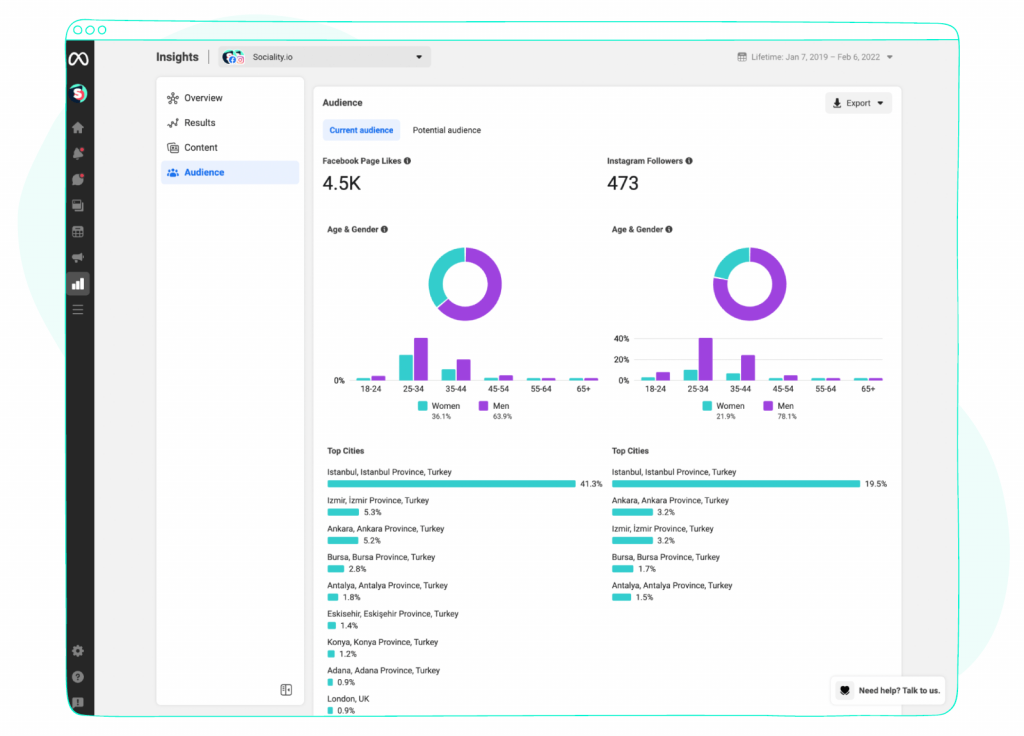
It might be confusing, but, yes, another extremely useful metric includes the word “Insights.” Audience Insights, enables you to observe your traffic within the most current audience’s details. With this tool, you go beyond superficial information and get an accurate picture of who watches and is interested in your content. Hence, you can effectively target ads.
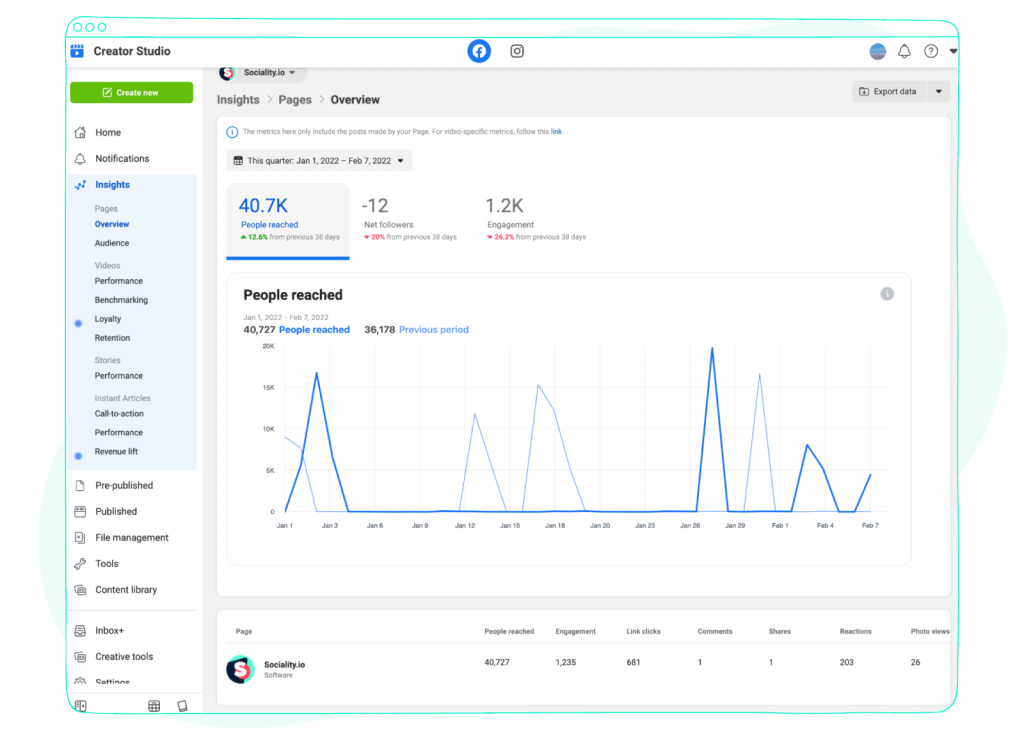
As the name suggests, Creator Studio’s section is designed specifically for content creators. It brings together all the tools a creator needs to publish, monetize, manage, track performance, and interact with fans across Facebook and Instagram channels. It is important to know that it can be a great source to learn new features or monetization opportunities you are eligible for.
| Meta Business Suite | Audience Insight | Creator Studio |
| Reach of your Page | Engaged viewers | Overview |
| Engagement | 1-minute viewers | Audience |
| Organic/boosted post content engagement | Videos your engaged viewers are watching | Performance |
| Likes and comments | Language | Loyalty |
| Cross-platform spend | Interests | Earnings |
| Demographic (basement, age, income, and gender) | Pages your engaged viewers like | Retention |
Talking about Instagram, remember it is bound to Facebook. Hence there are two ways to look after your Instagram performance:
- If you have a Instagram Business or Creator account, you can access a built-in Instagram analytics app. This Instagram native analytics tool can offer you generic reports about your account performance. You can browse metrics via the Insights action button. Note you can either view insights for your selected post or filter timeframe within the past 90 days.
- If you’re running paid campaigns on Instagram, you’ll definitely want to hook up Facebook Ads Manager. The Instagram Insights can provide information about your promotions, but you need Ads Manager to get a thorough cost analysis and detailed performance metric.
| Instagram App | Ads Manager |
| Reach | Performance |
| Shares | Cost per result |
| Saves | Amount spent |
| Traffic | Placement and delivery |
| Growth | Demographics |
| Best Time To Post | |
| Instagram Reels Engagement | |
| Instagram Stories Views | |
| Engagement Rate | |
| Sales |
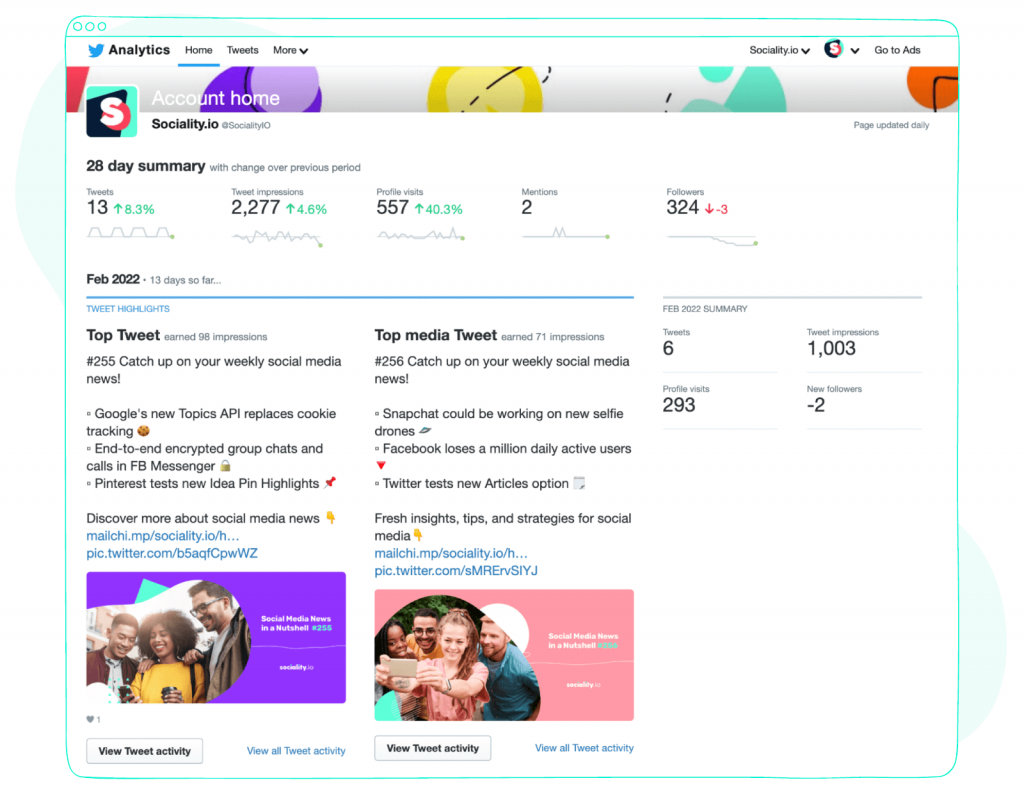
Twitter provides their own native analytics so that you will find all the metrics in-platform. Also, Twitter is unique because it doesn’t differentiate between personal profiles and business profiles. There’s only a standard profile option for every Twitter user to dig data, so the same kind of analytics are available for everyone. You can track such metrics as:
| Twitter analytics |
| FollowsDetail expands |
| User profile clicks |
| Link clicks |
| Retweets |
| Likes |
| Leads submitted |
| Impressions |
| Engagement rate (Number of engagements divided by impressions) |
| Engagements |
| Embedded media clicks |
LinkedIn appears to be a specific social media platform where businesses aim to tailor high-quality content that matches a particular audience’s interests. If you want to connect with people from your industry, these LinkedIn metrics are crucial to consider. To access the LinkedIn analytics, go to your LinkedIn profile and open Activity Dashboard, which will offer the following metrics for your observation:
| Activity Dashboard |
| Number of Followers |
| Viewer Information |
| Followers’ Demographics |
| Profile Views by Job Title |
| Company Update Stats |
| Impressions & Reach |
| Engagement Rate |
| Contact & Network Growth |
| Post Views and Engagement |
🧁 Related article: Simplify sales and lead gen with 10 LinkedIn automation tools
YouTube
All the professional videographers have definitely encountered YouTube. And to stay afloat they should not merely be curious about how much their video is attention-grabbing; they ought to rely on metrics that actually matter. Hence, navigate to YouTube, click on your profile icon in the top right-hand corner, and open YouTube Studio. This will send you to a dashboard with all the metrics available for your personal channel.
| YouTube Analytics |
| Watch Time |
| Who’s Watching Your Videos |
| Views Per Unique Viewers |
| Playlist Engagement |
| Subscriber Growth |
| Traffic Sources |
| Card Click-Through-Rate |
| Unique Viewers |
| Re-watches |
| Impressions Click-Through Rate |
| Audience Retention |
| Engagement |
| Audience Retention |
| Average View Duration |
| Average Percentage Viewed |
Automate social media metrics reports with the right software
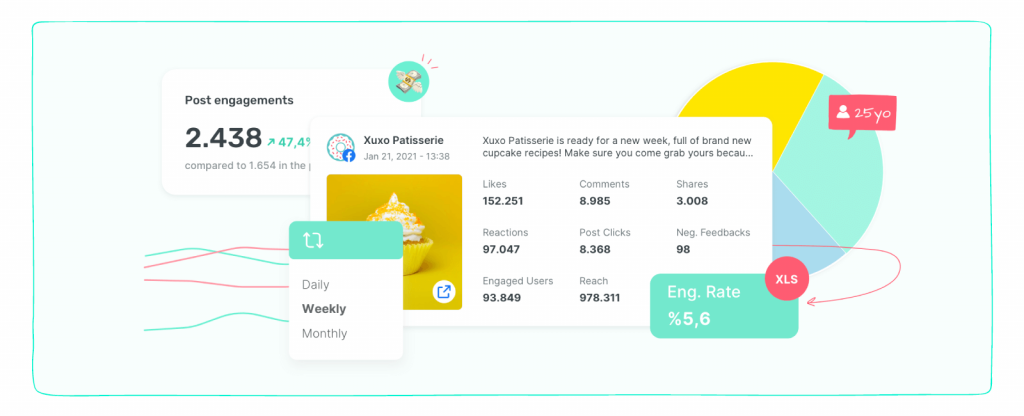
Despite each native social media platform providing their metrics, a lot of the time tracking them in 5 different dashboards is almost impossible for crowded teams. Such manual methods often create information asymmetry and poor decision making processes.
Sociality.io allows users to generate seriously detailed social media reports. Such reports provide 360 degree overview over multiprofile profiles across all social media platforms, team performance reports inside unified inbox, competitors’ metrics and more.
You can extract reports in PPT, PDF and Excel formats or connect social media data with your inner software via Sociality.io API.
Moreover, all reports can be easily scheduled and delivered to all stakeholders’ inboxes on daily, weekly, and monthly basis.
🥁 Bonus: 5 Proven steps to master social media automation (+ Free tools)
Final thoughts
To make an intelligent assessment of your social media performance, we recommend you start tracking those metrics right now.
Lastly, we’ve compiled this list with the most common and often essential metrics to pay attention to, but many other dozens of social media metrics can also help you boost your sales funnel. So, we encourage you to continue exploring the world of metrics and its nature. In the meantime, while you are analyzing metrics, keep in mind that these technological tools are also developed to customize someone’s needs. Business needs.


