


X/Twitter analytics guide 2026: How to check, track, and report performance
Summarize this article via
X/Twitter still attracts around 586 million monthly active users in 2026, according to Statista. It remains one of the biggest social platforms for brands that want visibility, engagement, and direct conversations with their audience.
Analytics makes the difference between assumptions and decisions. By tracking performance, you can:
- Identify what drives engagement
- Monitor growth patterns across campaigns
- Connect activity on X to conversions and revenue
If you are ready, let’s dive deep into X/Twitter analytics. But before that, here’s a brief summary of what we’ll be talking about below.
- Key takeaways
- What is X/Twitter analytics? Why do Twitter insights matter for marketers?
- How to see Twitter analytics in 2026: step-by-step guide 👀
- What does the X analytics dashboard include?
- Core X/Twitter metrics to track in 2026
- How to calculate real ROI from X/Twitter analytics
- 5 ways to deliver better insights for quality decisions
- How to use X/Twitter analytics tools to improve your strategy
- Limitations of native (free) X/Twitter analytics you should know 🌟
- How to export and report on X/Twitter analytics data
- Conclusion: Why X/Twitter insights & analytics help you grow smarter 🚀
Key takeaways
- Native analytics are split: Account-level dashboards now require Premium on desktop, while post-level analytics remain free on mobile.
- Core metrics to track: Impressions, engagement rate, profile visits, follower growth, replies/reposts, link/media clicks, and video metrics (retention, view rate, completion rate).
- Revenue signals pressure: X generated $2.5 billion in revenue in 2024, down 13.7% year-over-year (Business of Apps). A reminder that ROI and attribution matter.
- What dashboards give you:
- Account home → monthly report card + top posts.
- PAD → per-post detail with CSV export.
- VAD → video-specific performance (retention, view rate, completion).
- Ads → campaign and conversion tracking.
- How to act on data: Set benchmarks, refine formats (threads, polls, visuals), run small A/B tests, optimize posting times, and avoid vanity metrics.
- Limits of native tools: 28-day retention, shallow demographics, no competitor benchmarking, and Premium paywalls.
- AI is increasingly used to speed up X reporting: 59.5% of marketers use AI for analytics and reporting (Sociality.io, 2026).
What is X/Twitter analytics? Why do Twitter insights matter for marketers?
X, aka Twitter, changes quickly. What performs today could sink tomorrow. And Twitter analytics is the only way you can see what’s actually happening and turn activity into evidence you can act on.
Growth you can prove
Your reach and momentum shouldn’t be based on guesses. Analytics lets you track how far your posts travel and whether campaigns gain traction. If you see a spike, you’ll know what caused it.
Creative you can iterate
Hooks, captions, and visuals might feel strong, but the data will show which ones land. If threads keep pulling higher engagement than single posts, you can double down with confidence.
Revenue you can attribute
Clicks and conversions can be traced to specific posts or ads. Business of Apps reports that X generated $2.5 billion in revenue in 2024, down 13.7% from the year before. Declines like this are a reminder that ROI matters more than ever.
Customers you can hear
Mentions and replies may look like casual comments, but they often reveal pain points, ideas, or service gaps. By listening to these signals, you can shape your roadmap around what people actually need.
How to see Twitter analytics in 2026: step-by-step guide 👀
Over the past two years, X has moved most account-level analytics behind Premium on desktop. You’ll still be able to see post-level analytics for free in the mobile app under “View analytics.” If you’re managing a brand account, you might need to check both places depending on the depth of reporting you want.
Desktop (full dashboard — Premium)
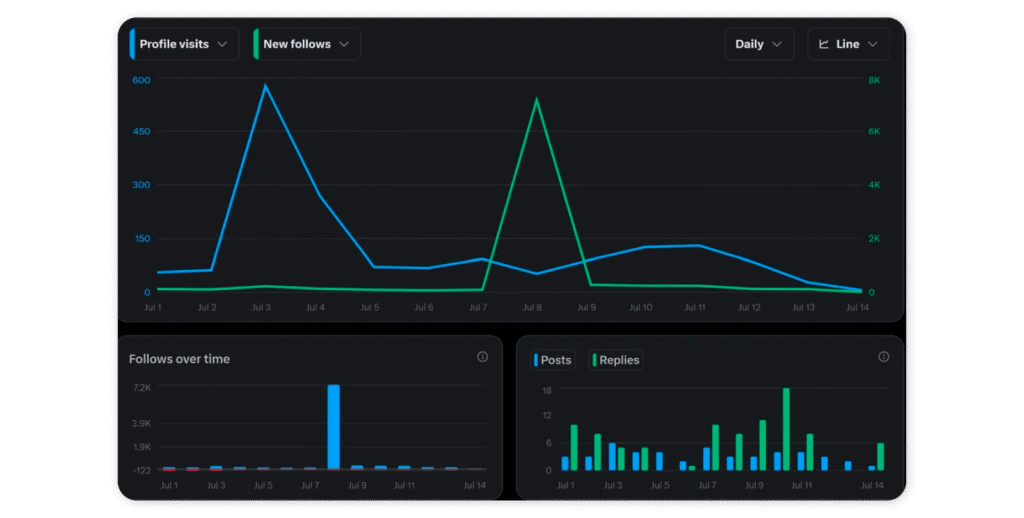
What you get: Overview charts (impressions, engagement rate, profile visits, follows), top posts, content breakdowns, and video analytics.
Where it lives: The Analytics page on desktop, now gated by X Premium.
Steps
- Log in on desktop.
- In the left rail, open Premium → Analytics (Quick Access). If the link isn’t visible, try analytics.twitter.com directly.
- Choose your range (e.g., 7, 28, 90 days+) and drill down into Content / Top posts / Video.
- (Optional) Export CSV for deeper analysis in Sheets/Excel.
X publicly rolled out an “improved analytics page” for Premium users in mid-2024; since then, the full dashboard has sat behind the subscription.
If “Analytics” isn’t in your menu, use the direct URL. If you still see an upgrade screen, your account needs Premium.
Mobile app (post-level — free)
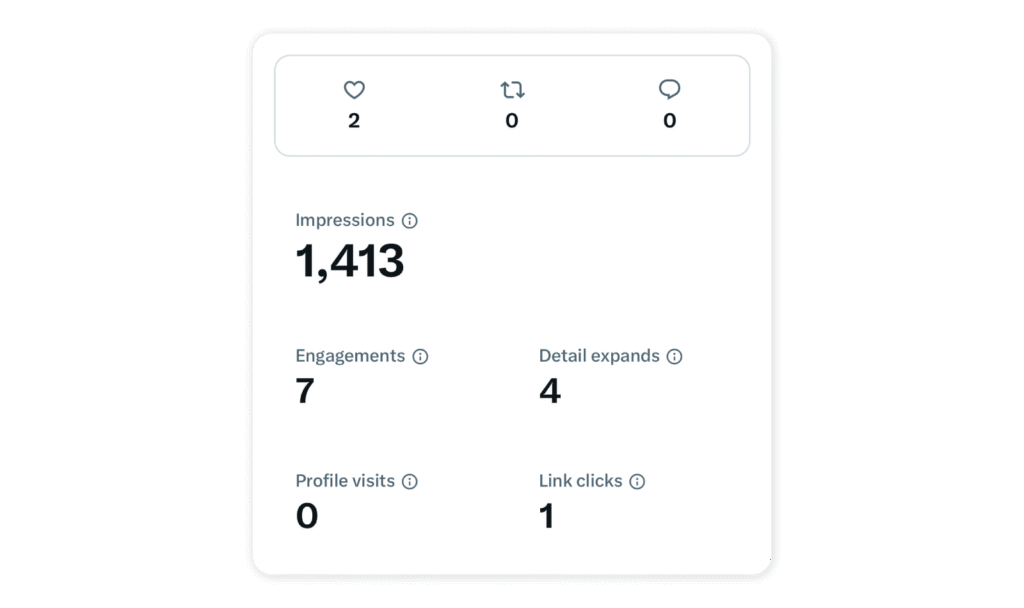
What you get: Analytics for an individual post—impressions, engagements, and clicks.
Where it lives: Inside each post.
Steps
- Open the X app.
- Find your post → tap View analytics.
- Review impressions, engagement, and click breakdowns per post.
Post-level analytics via “View analytics” has long been available inside the app, even as the desktop dashboard moved to Premium.
Third-party social media analytics tools like Buffer, Sociality.io, Hootsuite, and Sprout Social offer X/Twitter analytics. But, after Elon Musk rebranded Twitter to X, API costs increased drastically, leading many clients to stop tracking Twitter analytics and pushing many users toward relying on the native option.
| Access | Path | Premium needed | Scope | Export |
|---|---|---|---|---|
| Desktop (full) | Left menu → Premium → Analytics (or analytics.Twitter.com) | Yes | Account + content overview, top posts, video activity | CSV available |
| Mobile (post) | Open a post → View analytics | No | Per-post metrics | No native export |
What does the X analytics dashboard include?
X splits analytics into a handful of main views. Most accounts open on Account home, which gives you a snapshot of overall performance. From there, you can move into the Post Activity Dashboard (PAD) or Video Activity Dashboard (VAD) for post-level and video-specific details. Campaign and conversion reporting sit inside Ads, while Business Insights offers weekly recaps.
Let’s see what’s included as X shares:
Overview / Account home
It shows impressions, engagement rate, profile visits, follower changes, and a gallery of your top posts. X also flags your best-performing tweets and even surfaces influencers connected to your account. It’s the quickest way to pull a story together for stakeholders.
Post activity dashboard (PAD)
This view goes deeper into each post. You’ll see impressions, engagements, engagement rate, and the type of clicks (link, media, profile, etc.). You can adjust the date range and export a CSV if you need to slice the data further. There’s also a filter for promoted posts—handy when you want to separate paid from organic results.
Here’s a 2 min long YouTube video showing how you can see your PAD:
Top tweets
These are pulled into Account home automatically. Use them as a pattern library to spot which hooks, formats, or topics repeatedly win. It’s one of the easiest ways to build a repeatable content playbook.
Audience / follower views
Here you’ll find an overview of post performance, follower growth, and profile visits. Business Insights adds weekly recaps of followers and impressions. Together, these help you time your content better and monitor momentum over weeks and months. The depth of data may vary depending on your account and region.
Video activity dashboard (VAD)
This dashboard focuses on video performance—retention, view rate, and completion rate. You can filter for promoted views, adjust date ranges, and export CSVs. It’s where you’ll refine pacing, opening frames, and captions based on how long people actually watch.
Website & conversion views (where applicable)
Inside Ads, you’ll find dashboards that track campaign results. They show impressions, engagement rate, and cost-per-result based on the objective you set. If you’ve enabled conversion tracking, you’ll also see what happens after someone views or engages with your ad—whether that’s a sign-up, a purchase, or another action tied back to your site or app.
Core X/Twitter metrics to track in 2026
Analytics on X can feel like information overload. Charts, filters, and endless exports can bury the real story. To make sense of it, focus on the signals X itself puts front and center in Account home, the Post Activity Dashboard (PAD), the Video Activity Dashboard (VAD), and Ads. These are the metrics that connect directly to outcomes.
Impressions
Impressions count how often your post was shown across feeds, profiles, and search. It’s the baseline of visibility.
- Why it matters: Without reach, no other metric can exist. Impressions tell you if the algorithm distributed your post widely—or kept it contained.
- How to use it: Compare impressions across campaigns to identify which formats or hashtags push visibility. Keep in mind: impressions are not unique people—the same user can generate multiple impressions.
Engagements & engagement rate
Engagements cover all interactions: likes, reposts, replies, link clicks, profile visits, and media expands.
Engagement rate = engagements ÷ impressions
- Why it matters: It’s your quality bar. High impressions with low engagement? You reached people, but the content didn’t land.
- How to use it: Sort posts by engagement rate, not just raw engagement. That way, you spot which posts perform best relative to their reach. This helps when comparing paid vs. organic or big accounts vs. smaller ones.
Profile visits
Replies and reposts are broken out separately in PAD. They show people are reacting.
- Why it matters: This is curiosity in action. It’s the bridge metric between engagement and new follows or link clicks in your bio.
- How to use it: Track spikes after campaigns or viral posts. If profile visits rise but follower count doesn’t, review your profile picture, bio, and pinned tweet—they’re not converting visitors.
Conversation signals (replies and reposts)
Replies and reposts break out from the generic “engagements” category. They’re direct markers of conversation.
- Why it matters: These actions amplify your content (via reposts) and build public dialogue (via replies). They’re also signals of resonance—people don’t reply to content they don’t care about.
- How to use it: In PAD, review posts with high repost/reply ratios. Use them as cues for future conversation starters or campaigns with built-in virality.
Follower growth
Follower growth over time is more telling than the number itself.
- Why it matters: Net gains (or losses) reflect whether campaigns are bringing in a lasting audience. It’s also a proxy for brand momentum on the platform.
- How to use it: Align follower spikes with content calendars, PR announcements, influencer collabs, or ad pushes. Dips can be just as telling—did a campaign message miss the mark?
Link clicks & media clicks
These measure intent. Link clicks prove traffic is moving from X to your site. Media clicks show curiosity about your visuals.
- Why it matters: These metrics measure intent. Someone took action beyond scrolling.
- How to use it: Pair link clicks with UTM parameters to verify traffic inside your web analytics. Test headlines, preview images, or card setups when click-through is low.
Video metrics: retention, view rate, completion rate
VAD goes deeper than basic view counts. Retention shows how long viewers stayed. View rate shows what percent of viewers started watching. Completion rate shows how many reached the end.
- Retention – how long viewers keep watching.
- View rate – percentage of people who started watching out of those who saw the video.
- Completion rate – how many watched to the end.
- Why it matters: Raw view counts are vanity without retention. Completion rate shows if your story arc worked.
- How to use it: Test your hook (first 3 seconds), pacing, and subtitles. Shortening videos or front-loading your CTA often boosts completion.
How to calculate real ROI from X/Twitter analytics
Metrics are only useful if they connect to outcomes.
Impressions, engagement rate, and follower growth tell you what’s happening on-platform. But the real question marketers need to answer in 2026 is simpler:
Is X driving measurable business value, or just activity?
With Premium paywalls rising and ad costs fluctuating, you need a clearer way to translate analytics into ROI.
Here’s a practical model you can use.
The X ROI funnel: from impressions to revenue
Most performance on X follows the same path:
Impressions
→ Engagement
→ Clicks or profile visits
→ Conversions
→ Revenue
The mistake is stopping at the top.
High impressions without clicks are awareness.
High engagement without conversions is resonance.
But ROI comes from what happens after the post.
A simple ROI calculation you can apply
Let’s turn your X analytics into a measurable funnel.
For example, a campaign post generates:
- 100,000 impressions
- 3% engagement rate → 3,000 engagements
- 8% of engagements become link clicks → 240 clicks
- 5% website conversion rate → 12 conversions
- $120 average order value
Revenue 👉 12 × $120 = $1,440
Now, let’s compare that to cost; if you spent:
- $800 on ads
- $22/month on Premium analytics access
- Time cost for content production
Total cost ≈ $822
ROI 👉 (1,440 − 822) ÷ 822 = 75% ROI
That’s the difference between reporting metrics and proving impact.
Why it matters: engagement is not the finish line
X makes it easy to obsess over impressions or likes. But those numbers don’t tell you if your content is moving people toward action.
Instead, focus on metrics that signal intent:
- Link clicks
- Profile visits → bio conversions
- Conversion tracking (Ads)
- Video completion (for product storytelling)
These are the bridges between visibility and revenue.
Organic vs paid: ROI works differently
Not all performance should be judged the same way.
| Signal | Organic posts | Paid campaigns |
|---|---|---|
| Primary value | Brand + trust | Conversions + scale |
| Attribution clarity | Medium | High |
| Cost | Time + team resources | Budget-driven |
| Testing speed | Slower | Faster |
Organic content builds long-term demand.
Paid campaigns capture demand quickly.
The smartest strategy is using analytics to decide when to lean into each.
When X might not be worth the investment
Analytics is also how you know when to stop. In those cases, impressions become noise instead of growth:
- Engagement rate stays below ~0.5% consistently
- Link click-through is under ~0.3%
- Your conversions come mainly from other channels
- Your audience isn’t active in your niche on X
The takeaway: Measure what moves the business
In 2026, the teams winning on X aren’t the ones chasing viral posts.
They’re the ones who can answer:
- What drives clicks?
- What drives conversions?
- What’s repeatable?
- What’s profitable?
So, once you treat X analytics as a revenue model, not a vanity dashboard, you stop guessing and start investing with confidence.
5 ways to deliver better insights for quality decisions
While there is a significant amount of data available on Twitter Analytics, there are five key insights you should retain to make high-quality decisions in future social media marketing campaigns.
Top tweets
Each month, your main analytics dashboard will display your top Tweet and top media Tweet (by impressions). When you click “View Tweet activity”, you’ll be able to see the specific engagement broken down into categories like link clicks, profile clicks, and more.
By seeing what your top-performing tweet of the month was, you’ll be able to assess the content of the tweet to see why it resonated so well with your audience. Perhaps it was the use of a certain emoji, a certain call-to-action, or the use of consistent corporate branding. You can then replicate these elements in future Tweets to spike engagement in a similar way.
Follower growth
In this section of Twitter metrics, you can see how much your following has changed over the last 30 days (including how many followers you’ve gained and lost in that period).
Having access to this data can help you assess highs and lows in your follower count and correlate these trends to the content you published on those days. With this information, you can determine what content your audience is enjoying and what content is potentially prompting people to unfollow you.
This is an integral component of Twitter Analytics, particularly for marketers who are looking to grow their follower counts. After analyzing these details, you can also consider launching a followers campaign to increase your number of engaged followers.
Conversion quality
Conversion quality is one of the powerful Twitter metrics available. It allows you to see if a follower has engaged with one of your Twitter Ads and has been converted (e.g. has purchased your product). This conversion will then be tracked and attributed to your Twitter ad.
This social media metric allows you to clearly see the ROI on your ad by tracking and assessing the actions of users when they view and/or engage with your Twitter Ads.
Mentions
Here, you can see your @mentions for the last 28 days; your top mention from the previous month will also be shown. This section of Twitter Analytics is invaluable because it provides you with key insight into which accounts are interacting with yours.
This is also particularly valuable from a customer service standpoint as you can track which of your customers are mentioning your account in their tweets, asking questions, airing concerns or grievances about customer service, and more.
Follower demographics
Under the Followers tab of Twitter Analytics, you’ll be able to see the breakdown of the locations, ages, and genders of your followers.
You can shape your messaging based on this information to ensure higher levels of engagement in future tweets. For example, if your audience is predominantly women, you can adjust your marketing strategies to align with a female audience, such as highlighting causes related to female empowerment and/or collaborating with female influencers.
How to use X/Twitter analytics tools to improve your strategy
Analytics and Twitter insights can only be powerful if you act on them. Numbers shouldn’t be a scoreboard. They should guide your next move and tie performance back to real business results.
Here’s a brief YouTube video that explains how to grow a small X/Twitter account by making the algorithms love you:
Set benchmarks and goals
X still counts around 245 million daily active users in 2026. Even small percentage gains could mean thousands of extra eyes. With 5.42 billion social media users juggling nearly seven platforms each, attention is fragmented. You’ll need clear goals—like lifting engagement rate by 20% or boosting link clicks by 30%—to know what progress looks like.
Refine content strategy
Your analytics will show you which formats work. If threads consistently outperform single posts, or polls drive more profile visits, you should lean into those. The point isn’t guessing—it’s spotting repeat wins and repeating them.
Experiment and test the impact
You could run A/B tests with hooks, visuals, or CTAs. Compare engagement rate, clicks, or conversions across versions. Simple tests—say, posting a thread vs. a single image—might reveal what your audience actually prefers.
Optimize posting schedule
Check when your followers are most active. If your audience is mostly US-based, late afternoons or evenings may be your sweet spot. Post when they’re online, and you’ll likely see stronger impressions and engagement.
Avoid vanity metrics
Big follower counts or impression totals might look nice, but they don’t tell you much. Instead, focus on profile visits, link clicks, conversions, or video completion rates. These are the metrics that actually map to business outcomes.
Limitations of native (free) X/Twitter analytics you should know 🌟
Native analytics will give you a solid start, but there are gaps you should keep in mind. Data is limited to 28 days unless you export it. Demographic details are shallow, competitor benchmarking doesn’t exist, and updates can lag. On top of that, many advanced features now sit behind Premium after Elon Musk bought Twitter and rebranded it as X.
How to export and report on X/Twitter analytics data
Once you’ve collected your numbers, you’ll need to package them into something useful.
With native analytics, you can export CSV files from Account Home, PAD, or VAD. That gives you the raw data for impressions, engagement, profile visits, clicks, and video metrics. From there, you might load them into Sheets or Excel, build charts, and map them against campaign dates.
If you prefer a manual report, pick 3–5 core KPIs (like engagement rate, follower growth, or conversions), add visuals, and write a short story that links results to actions. Always finish with recommendations, not just data.
AI is now part of many reporting workflows but the best teams use it with guardrails. In our 2026 survey, 78.4% of marketers said they apply moderate or extensive editing before publishing AI-assisted content. That same principle applies to analytics summaries: use AI to speed up drafts, patterns, and narrative structure—but keep humans responsible for interpretation, context, and factual accuracy.
A simple AI-assisted reporting workflow (that stays accurate):
- Export your X analytics CSV (PAD/VAD) and paste key rows into your report doc.
- Ask AI to: summarize trends, flag anomalies, and draft 3–5 insights with the numbers quoted back.
- Manually verify every metric claim against the CSV.
- Add context AI can’t know: campaign notes, creative changes, budget shifts, seasonality.
- Finish with decisions: what to repeat, what to stop, what to test next week.
Quick Summary
X (formerly Twitter) has 586 million monthly active users in 2026, keeping it a key platform for marketers. Analytics access is split: account-level dashboards require Premium on desktop, while post-level metrics remain free in the mobile app. Core KPIs include impressions, engagement rate, follower growth, clicks, and video completion. With revenue falling to $2.5B in 2024 (-13.7% YoY), ROI and attribution tracking are more critical than ever. Native dashboards (Account Home, PAD, VAD, Ads) provide essential insights, but pairing them with testing, benchmarks, and tools like Sociality.io gives marketers the complete picture.
Conclusion: Why X/Twitter insights & analytics help you grow smarter 🚀
X/Twitter still holds the attention of hundreds of millions of people every month. That makes it a powerful channel—but also a competitive one. You’ll need analytics to see what works, what falls flat, and where your audience is actually paying attention. This way you’ll get more X/Twitter followers and increase your engagement.
From impressions and engagement rate to profile visits, follower growth, and video completion, the native dashboards give you the building blocks. They’ll help you set benchmarks, refine content, and align campaigns with real outcomes.
But the limits are real: short data windows, missing competitor views, and many features locked behind Premium. If you want deeper history, sentiment analysis, or automated reports across platforms, you’ll need a tool that goes further.
That’s where Sociality.io comes in. It pulls X/Twitter analytics into one hub, alongside Instagram, TikTok, LinkedIn, Facebook, and YouTube. It saves you time, fills the gaps, and delivers reports you can actually act on!
If you’re ready to stop guessing and start making decisions with confidence, it might be time to bring all your social media analytics together.