


How to use Instagram Stories analytics to make better Stories
Summarize this article via
For marketers strategizing to grow their brand’s Instagram account, deciphering Instagram analytics or Insights is the first significant step. You can access insights on Stories, Reels, videos, Live videos, and even engagement on individual posts. All of this information can help you know more about your followers and account’s performance, enabling you to improve your content strategy, increase engagement with the target audience, reach a new audience, and much more!
To help you achieve your marketing goals, we will focus on IG Stories analytics in this article. If you are wondering why then it is because Stories have the power to leave an impression! Around 58% of the users agreed that they got interested in a brand after viewing its story, and it comes as no surprise that brand stories have a completion rate of around 86%.
So let’s get you started with Instagram Story analytics and how you can optimize Stories for improved metrics!
How to check Instagram analytics for Stories
Primarily, you can view IG stories analytics in the following ways:
- Using Instagram Insights
- Using social media management tools or Instagram analytics tools
Apart from these two, you can also explore Facebook’s or Meta’s native dashboards to get relevant insights:
- Creator Studio for Instagram
- Meta Business Suite
- Commerce Manager (if you have set up a shop on Instagram)
Using Instagram Insights
To access Instagram Stories analytics in Instagram Insights,
- Go to your profile on the Instagram app (make sure it is a business or a creator account).
- Tap on the Insights button, or you can go to the menu (
) on the top right-hand-side corner and tap on Insights.
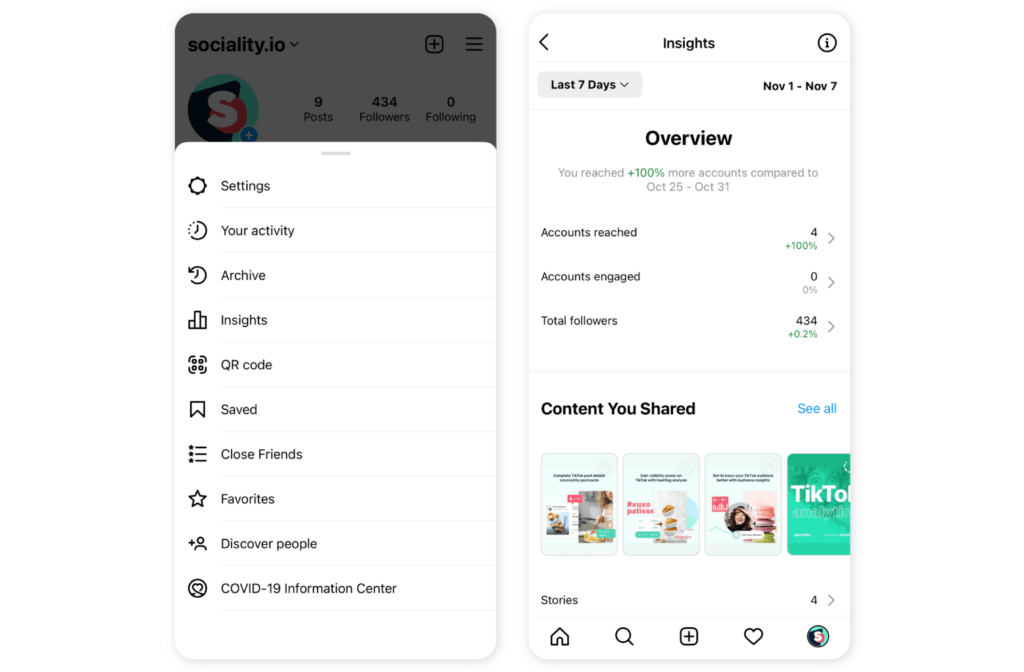
- Move down, and you will see Content You Shared. This section gives you an overall idea of the number of posts, Stories, Reels, videos, Live videos, etc., that you’ve shared.
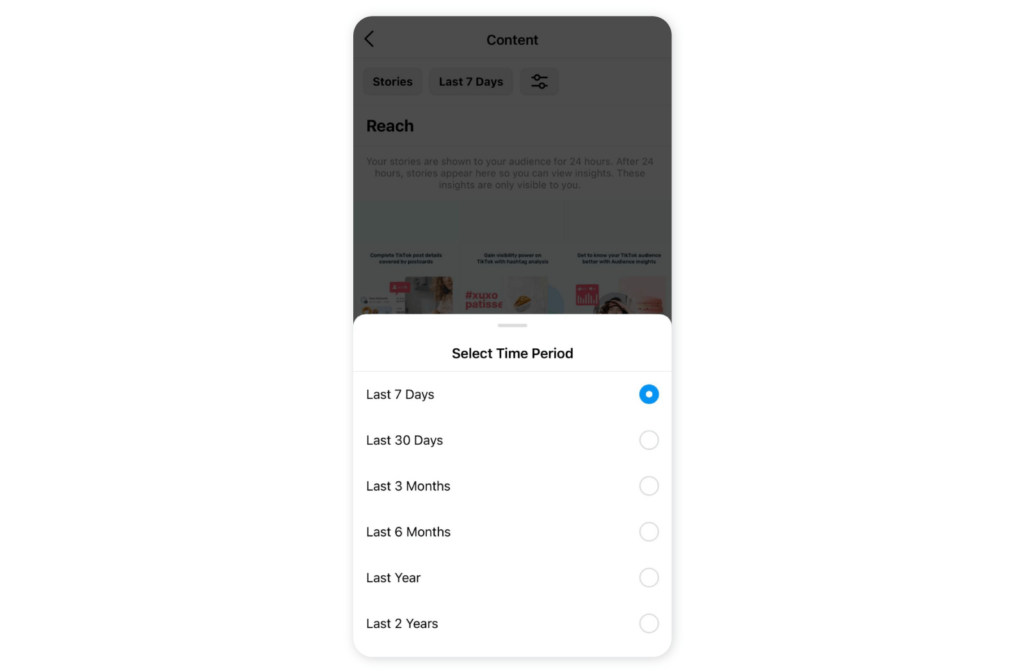
- In this tab, you can view all your previously published stories. The default timeline is the Last seven days, but you can change it based on your needs. It ranges from Yesterday to the Last 2 Years.
- You will see the Instagram Stories metric in the top left-hand-side corner. Tap on the dropdown arrow to select the metric you would like to analyze.
List of 17 metrics that are available for Instagram Stories
- Back
- Forward
- Exited
- Follows
- Next Story
- Call Button Taps
- Business Address Taps
- Website Taps
- Text Button Taps
- Email button taps
- Impressions
- Link Clicks
- Profile Visits
- Reach
- Replies
- Shares
- Story Interactions
Select the time frame and the metric, and you can analyze that metric of every previously published story.
Alternatively, you can tap on any story and swipe up to view Story analytics. Tap on the chart () and the eye icon (
) to see who all have viewed the story and other insights.
In case you want to check the analytics of your current or active story, just tap on the story and swipe up.
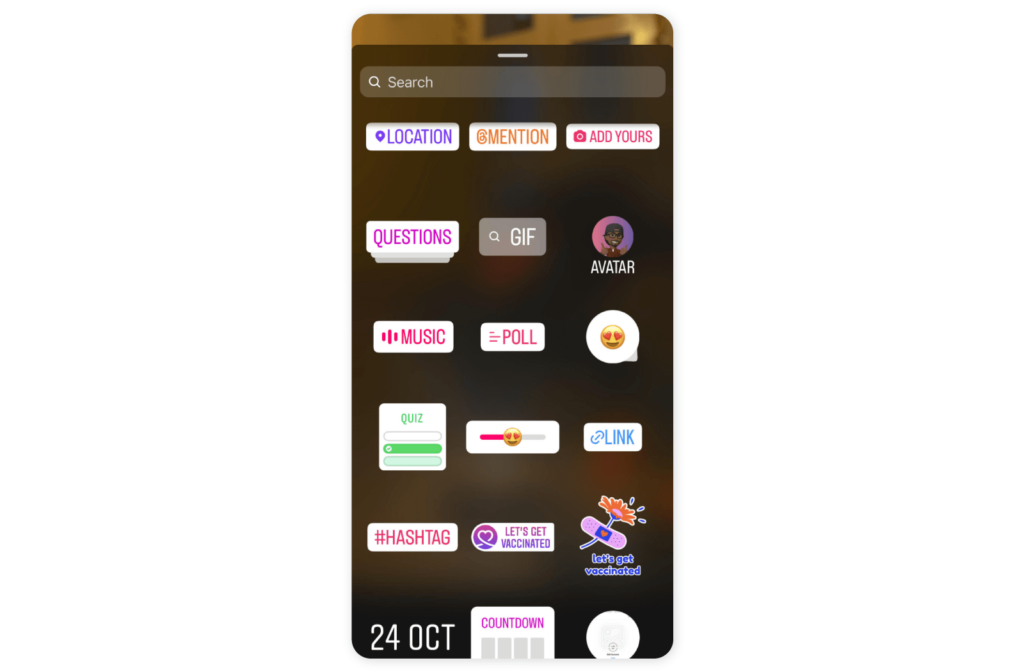
If you have posted a Story with a poll or other interactive stickers, then you can view the results by clicking on the eye icon ().
Instagram Stories metrics and what they mean
| Accounts reached | It is the number of accounts that have viewed the story at least once. Reach and impressions are different because impressions may include multiple views of the story from the same account. |
| Accounts engaged | It is the number of accounts that have interacted with the story. It can include shares or replies (including text or quick reaction replies). |
| Profile activity | It is the number of actions taken when people visit your profile after engaging with the story. |
| Impressions | Total number of views, may include multiple views of the story from the same account. |
| Shares | The number of times a story was shared. |
| Replies | The number of times people replied to a story. |
| Product button clicks | The number of times people visited a product page from the story and tapped the button on the product page. |
| Link clicks | The number of clicks on the swipe-up link in your story. |
| Sticker taps | The number of taps on location, hashtag, mention, or product stickers in the story. |
| Forward | The number of taps to see the next video or image in the story. |
| Back | The number of taps to see the previous video or image in the story. |
| Next story | The number of taps to the next account’s story. |
| Exited | The number of taps to leave the story. |
| Profile visits | The number of times your profile was visited. |
| Follows | The number of accounts that started following you. |
| Email button taps | The number of taps to email your business. |
Using Social media management tools or Instagram analytics tools
Various digital marketing solutions offer an easy means to view your entire Instagram analytics, including Instagram Stories metrics. Sociality.io is one such popular and upcoming social media tool that can give you much-needed in-depth insights.
With a unified dashboard from Sociality.io, you can manage key social media tasks, including scheduling and publishing posts, benchmarking competitors, social listening, engaging with the audience, and, most importantly, monitoring analytics.
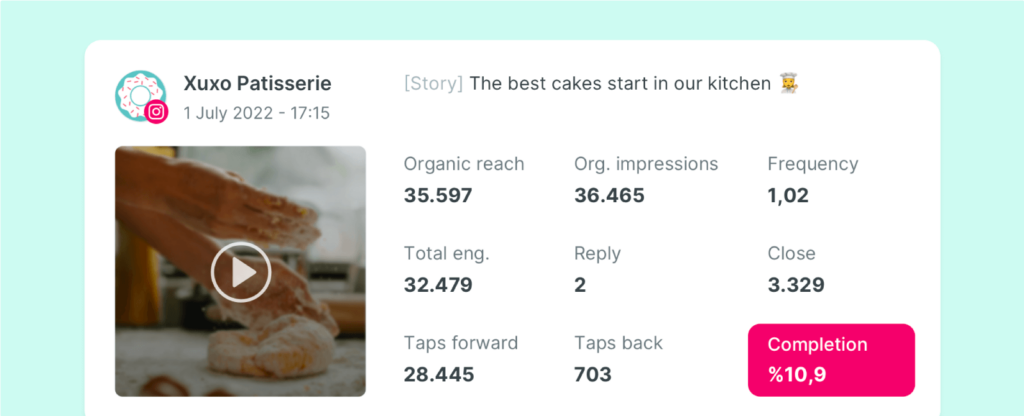
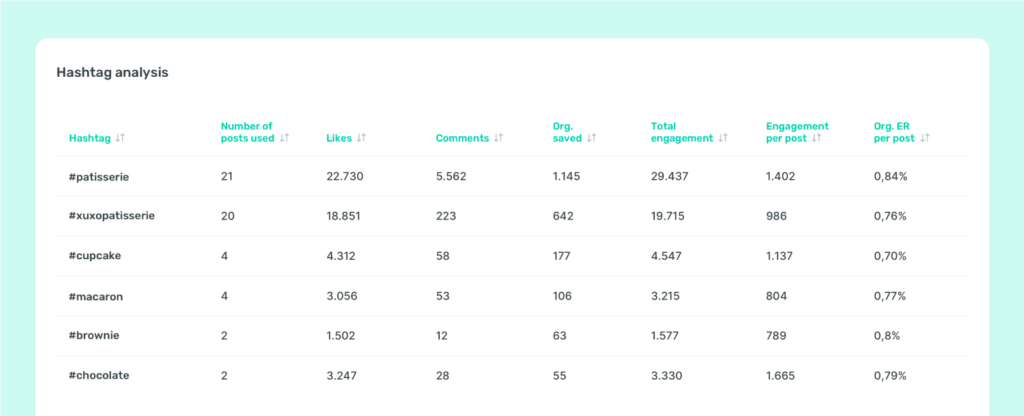
Its Instagram analytics module offers insights for custom time frames on Posts, Reels, Stories, Videos, Hashtag analysis, and much more.
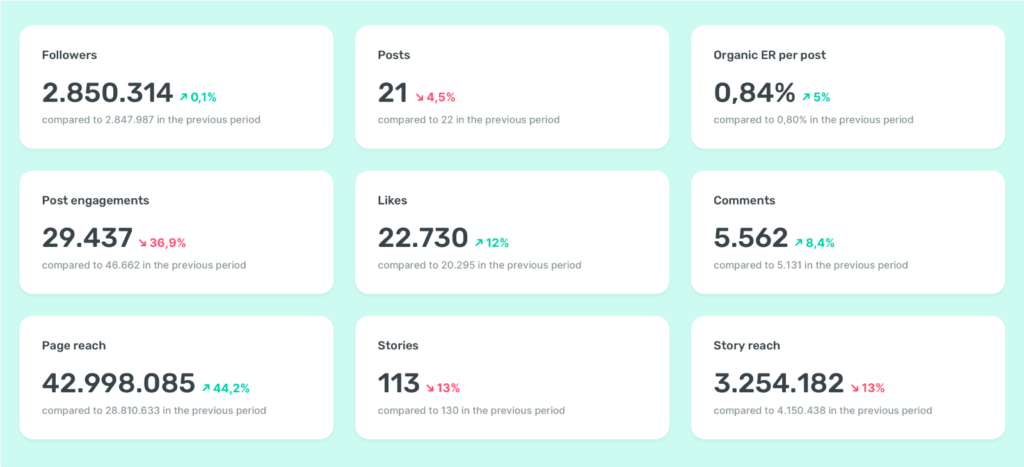
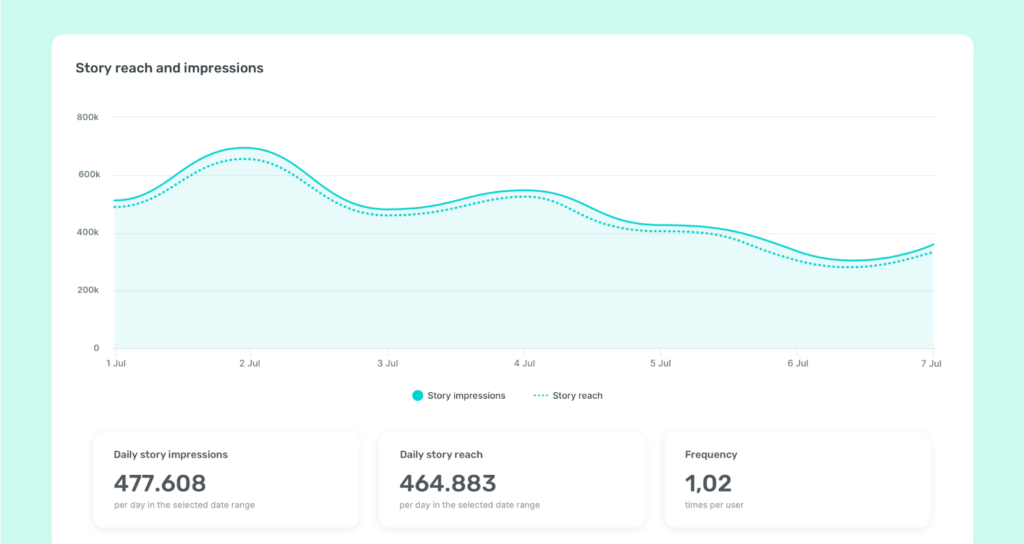
Sociality.io provides the following actionable insights into your Stories:
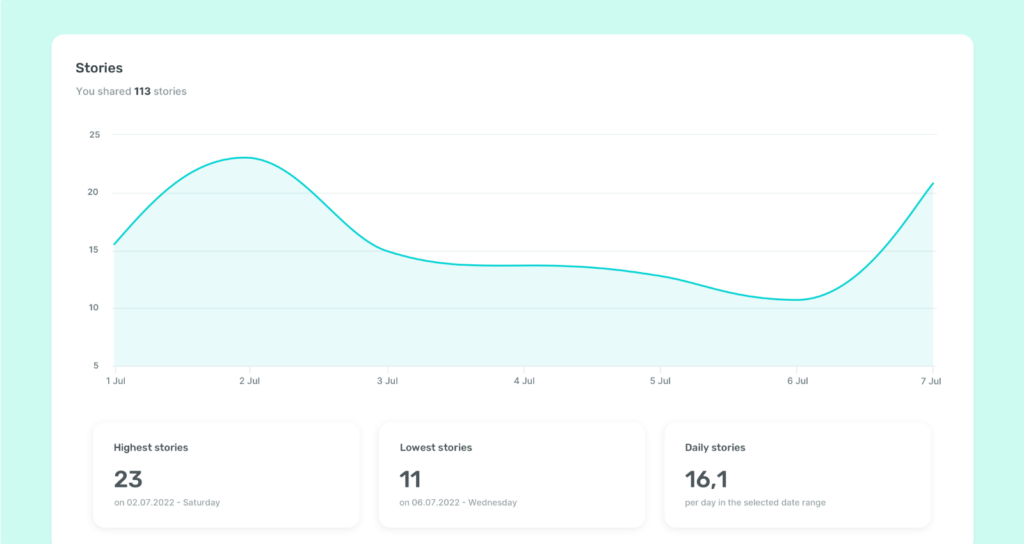
- No. of stories published throughout the time frame.
- Story reach and impressions
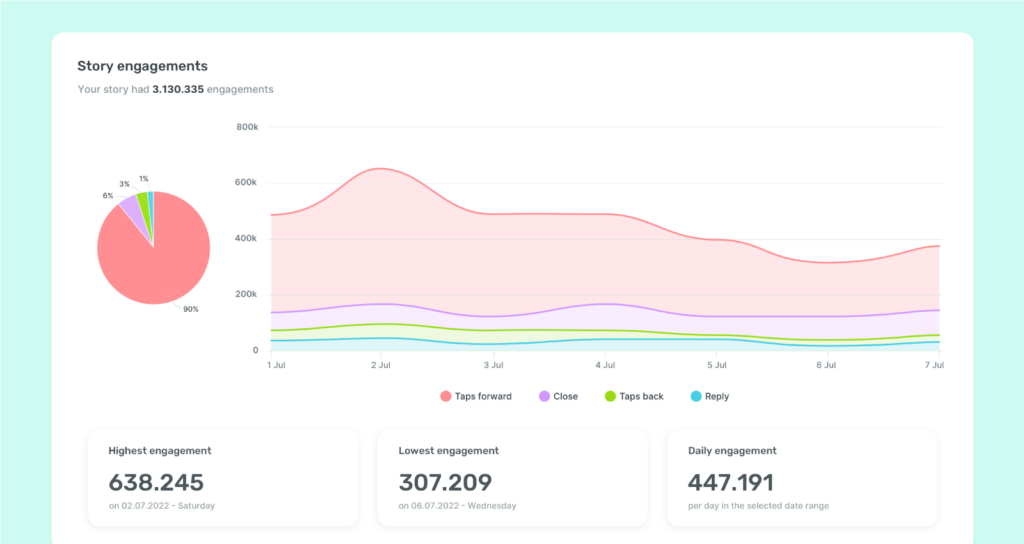
- Story engagements including taps forward, taps back, reply, close
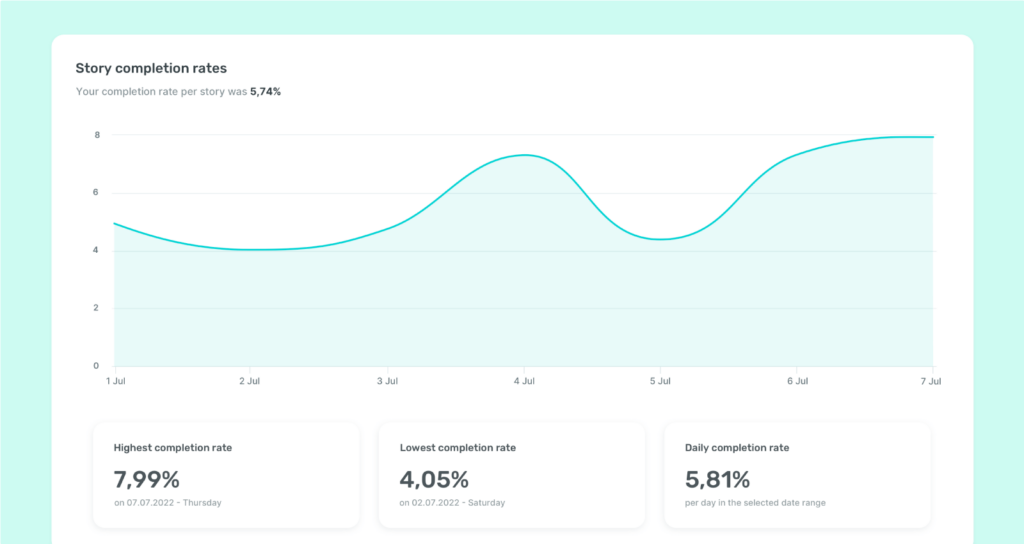
- Story completion rates
You can apply relevant filters to get a consolidated view of story analytics with just a few clicks!
How to use Instagram Story analytics to optimize your Story performance
Here are some effective tips to help you create better stories!
Unravel your content strategy
Identify top-performing stories to figure out what is working well for you. Is it a poll, quiz, video, image, or interactive sticker? Since Stories give you a creative outlet, you can keep them short and sweet and experiment with outshining your competitors.
Pro tip: Use one clear call-to-action (CTA) that matches the objective of your story. You can make your CTA stand out with stickers. Moreover, you can improve the discoverability of your story with a hashtag or location sticker.
Pay attention to your audience
Analyze how your followers are interacting with the stories, especially polls, quizzes, or links. You can use these responses to improve your content as well as your product or service. For instance, when you run a poll, be direct and clear to let people voice their opinions.
Pro tip: From audience insights, figure out what day and the time your audiences are most active. Utilize that time frame to publish your Story to reach the maximum number of people.

Keep track of your hashtags
Reposting user-generated content is one of the easiest and most proven ways to generate new content. Keep track of the hashtags used and promoted by your brand to discover new content, as you may not always be directly tagged in such posts or stories. Here, hashtag analysis and brand monitoring can prove useful.
Final Words
With huge potential and unlimited creativity, Instagram Stories have caught the attention of marketers and audiences alike. Now is the right time to not only understand your IG stories metrics but to utilize those analytical insights to achieve your marketing goals.
When you publish multiple stories every day, keeping track of each metric may get cumbersome. This is where social media management tools can make your life easier by consolidating all relevant metrics on a single dashboard to help you make the right strategic decisions.