
An Instagram competitor analysis compares your account with rival accounts on followers, posting, formats and engagement, then reads their content and ads to explain the gaps. Every public profile shows part of it, Meta now sells a dashboard for it, and a spreadsheet or a social media competitor analysis tool covers the rest.
Instead of reinventing the wheel, you learn from competitors’ successful content and avoid repeating their mistakes. This article is the checklist we’d use on a competitor’s Instagram page, in order, with a worked example from October 2026 and a free report template at the end.
TL;DR: Instagram competitor analysis in five points
- A public Instagram profile shows followers, posts, comments, likes (unless the owner hides like counts) and Reels views. Reach, saves, shares and demographics stay in the owner’s Insights.
- Meta One’s Advanced plan adds Competitive insights, a paid dashboard that compares your account with other public accounts.
- Instagram’s Help Center defines interactions but publishes no engagement-rate formula. For competitors, divide likes and comments by followers, and judge Reels by views separately.
- The Meta Ad Library shows every advertiser’s active ads; ads shown in the EU stay searchable for a year.
- In our October 2026 example, one brand’s engagement rate looked three times higher; without the engagement it paid for, the gap was 1.5x.
What Instagram and Meta show you about competitors
Before you pick competitors or open a spreadsheet, it helps to know what Instagram already gives you for free, what Meta sells, and what nobody outside the account can see.
On a competitor’s public profile
Any public account shows its follower count, the accounts it follows and its number of posts. Each post shows its date, its format and its comments, and Reels usually show a view count. Likes are visible too, unless the owner turned them off: since May 2021, people can hide like counts on their own posts. What you never see is the owner’s Insights. Views on photos and carousels, reach, saves, shares, profile visits and follower demographics are owner-only metrics, so a competitor analysis works with public numbers and treats everything else as unknown.
Instagram’s own professional dashboard also has a section for ideas from similar businesses and creators, with high-quality posts and ads to browse. It’s inspiration rather than measurement, and Instagram says the tools in it vary by account type, region and eligibility.
Meta One Competitive insights
In September 2026, Meta launched Meta One subscription plans for creators. The Advanced plan ($49.99 a month) includes Competitive insights, which compares your performance with other public accounts in your space in a single dashboard. The same plan keeps your insights history beyond 90 days and lets you download it as a CSV file. Meta says plans, pricing and availability vary by region, app and account, so check what your account is offered before you budget for it.
Meta AI benchmarking
Meta AI (the app, meta.ai and the Mac app) can connect to your Instagram and Facebook accounts and benchmark your business against similar brands by analyzing their public content and engagement patterns. Meta says it’s free to get started, with more use through Meta One. We’d treat it as a fast first read: a monthly report needs the same metrics, pulled the same way, every month.
Business Discovery, for teams with developers
If you have a developer, Instagram’s Business Discovery API returns basic metrics for other professional accounts: follower count, post count and, per post, likes, comments and Reels views. It skips age-gated accounts, and like counts drop out where the owner hid them. Scraping is a different matter: Meta’s Automated Data Collection Terms require Meta’s express written permission before any bot or scraper collects data, Instagram included.
How to find Instagram competitors
Most likely, you can name your business competitors right away. Start with three to five of them that sell to the same customers, then check that their accounts are active and public. A competitor that posted twice this year won’t teach you much.
In the world of Instagram, your indirect competitors are as important. Every brand on social media competes for the same attention: news pages, meme accounts, creators and celebrities all fight for the engagement your posts need. To find them, read your potential customers’ conversations in comments, online communities and forums, and note which accounts they mention and share.
Size matters for a fair comparison. A brand with 30 million followers and one with 30,000 won’t teach each other much, because their budgets, teams and audiences differ. Keep most of the list in roughly your follower range, plus one account you aspire to. And if your niche has almost no direct competitors, compare yourself with accounts that serve the same audience in a neighbouring category.
Theme pages: finding the best recent Reels in a niche
Theme pages (fan, meme or aesthetic accounts built around one topic) need a different list. Collect the 15 to 20 accounts in your niche, open each one’s Reels tab and note the recent Reels with the most views compared with that account’s usual results. A Reel that beat its own account’s average is a better signal than the biggest number in the niche. Adapt the idea, not the clip: Meta says 75% of Instagram recommendations now come from original posts, so reposted content travels less.
Which Instagram metrics you can compare with competitors
Most mistakes in Instagram competitor analysis come from comparing a number you can see for your own account with one you can only estimate for theirs. Here’s where the line sits.
| Metric | Your account | A competitor’s account | How to compare fairly |
|---|---|---|---|
| Followers | Insights | Profile | Same date for every account; growth as a percentage |
| Posts | Insights | Profile, or count the grid | Posts per week, by format |
| Likes | Insights | On each post, unless hidden | Per post, same date range |
| Comments | Insights | On each post | Per post; check for giveaways |
| Reels views | Insights | On each Reel | (Likes + comments) ÷ views, Reels only |
| Views on photos and carousels | Insights | Not available | Your own trend only |
| Reach, saves, shares | Insights | Not available | Your own trend only |
| Follower demographics | Insights | Not available | Read who comments, by hand |
| Ads | Ads Manager | Meta Ad Library: creative and dates | Creative and timing, never spend |
Because likes can be hidden and views only exist for Reels, the one engagement rate you can calculate for every competitor is likes plus comments divided by followers. Instagram’s own Insights definitions count views, interactions and accounts engaged for your account, and none of them for anyone else’s.
How to find competitors’ top Instagram posts
Find top posts, aka unicorn content, by sorting each competitor’s posts from the last 30 or 90 days by likes plus comments, and Reels separately by views. By hand, that means scrolling the grid and the Reels tab and logging each post in a sheet. The Sociality.io Instagram competitor report does it for up to 15 accounts at once, so you can quickly analyze competitors’ content strategy in a sortable Posts table. Here are Rockstar Energy’s top posts for October 2026:
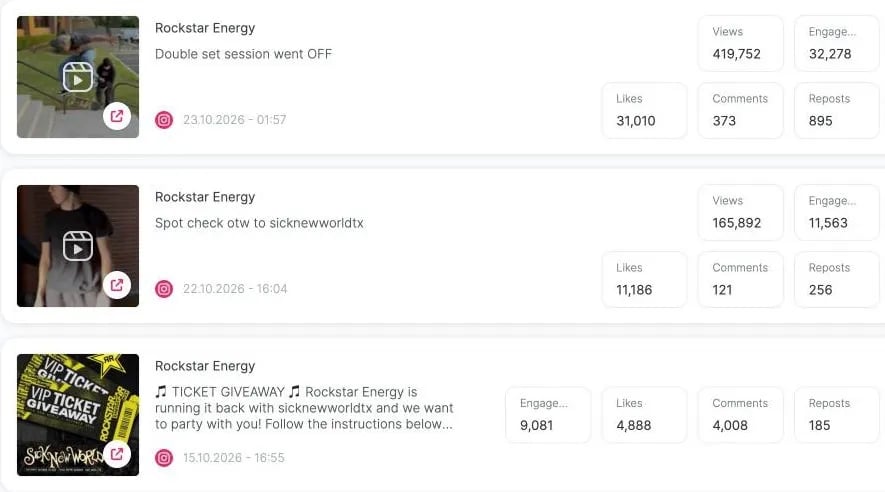
On top of that, Sociality.io keeps the likes, comments, reposts and views for each post and separates organic and paid engagement, so a boosted post doesn’t pass for an organic hit. Its filters also cover competitors’ deleted posts. To check a competitor’s Reels specifically, see how to analyze competitor Reels with analytics and an AI chat.
Which type of Instagram posts performs best?
Content is the heart of every social media page. It can either convince customers and tell your business story in a way that sells or make them want to run away from your Instagram page. Competitor analysis shows what your shared audience already responds to, before you spend money finding out.
Start with the formats each competitor uses. As you know, the list has grown since the days of IGTV. In 2026, you’re looking at:
- Reels
- Single photo or video posts (IGTV and feed videos became Instagram Video in 2021)
- Carousels of up to 20 photos and videos
- Stories, which disappear after 24 hours, so log them the day they run
- Live videos
- Collabs, where up to three co-authors share one post, so it appears on each account
- Trial Reels, which are shown to non-followers first, so a competitor may be testing ideas you never see in their grid
Count formats by scrolling competitors’ pages, or open the Post types chart in a Sociality.io competitor report to see the split for each account:
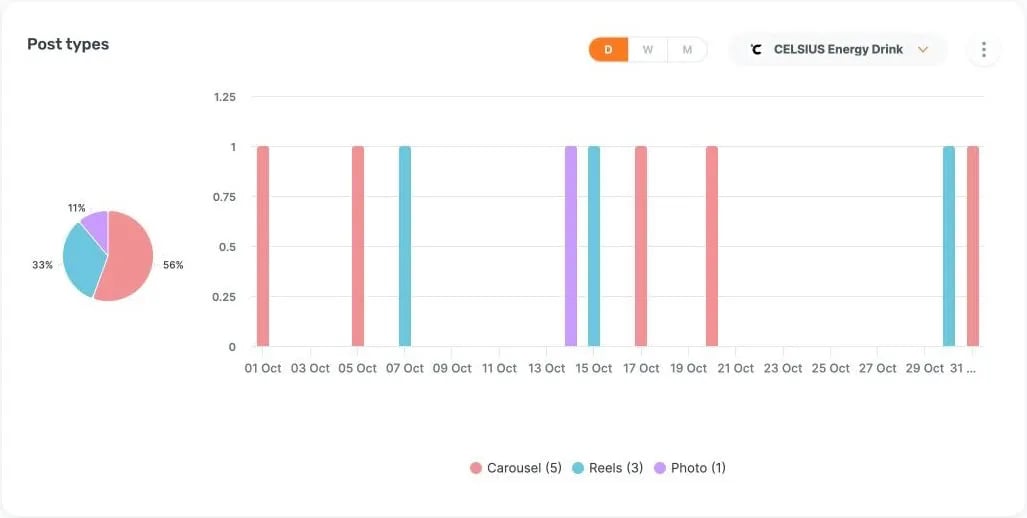
You don’t have to copy your competitors’ formats, but this step shows which one works for them and which one doesn’t. Investing in video production might be expensive; if Reels clearly carry a competitor’s engagement, you’ll have their numbers in hand before you spend.
Hashtags and campaign tags
Since December 2025, Instagram allows up to 5 hashtags in a reel or post, so competitors now have to choose. Write down which tags each competitor repeats and which are their own campaign hashtags, then compare the likes and comments on posts that carry a campaign tag with their usual posts. Brand voice is different: caption tone and length vary from business to business, and there is no right or wrong approach. You may also be interested in “Debunking 6 Instagram hashtags myths social media marketers follow”.
Analyze Instagram competitors’ community management tactics
Besides content type and quality, make sure to understand which tactics your competitors are using for community management. You’ll need community management tools for this step.
How active are your competitors on Instagram, and how often do they post and reply to their followers? The answer gives you a feel for how big their social media marketing team is and whom you are competing with.
Keep in mind that posting three posts per day and interacting with every comment is not always the best tactic. You need to pair this info with the performance to understand if the chosen frequency works for that competitor or not.
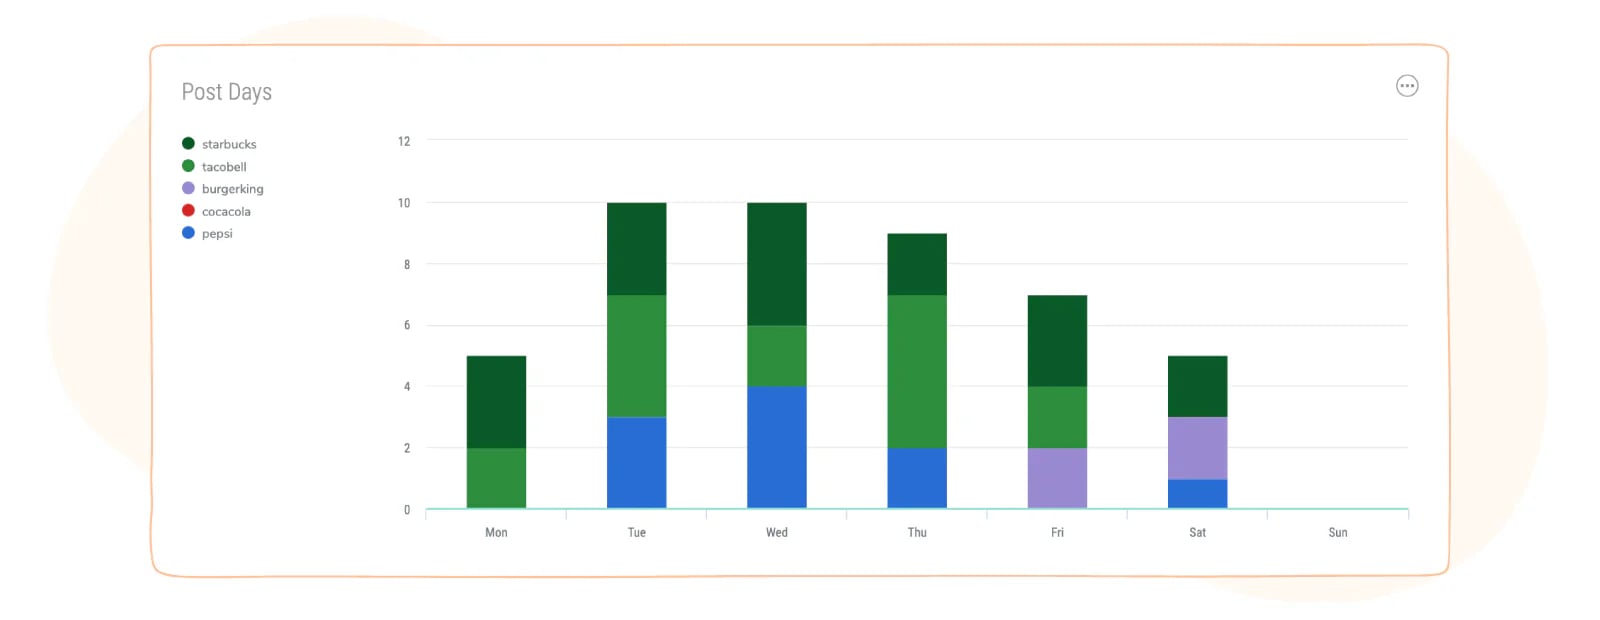
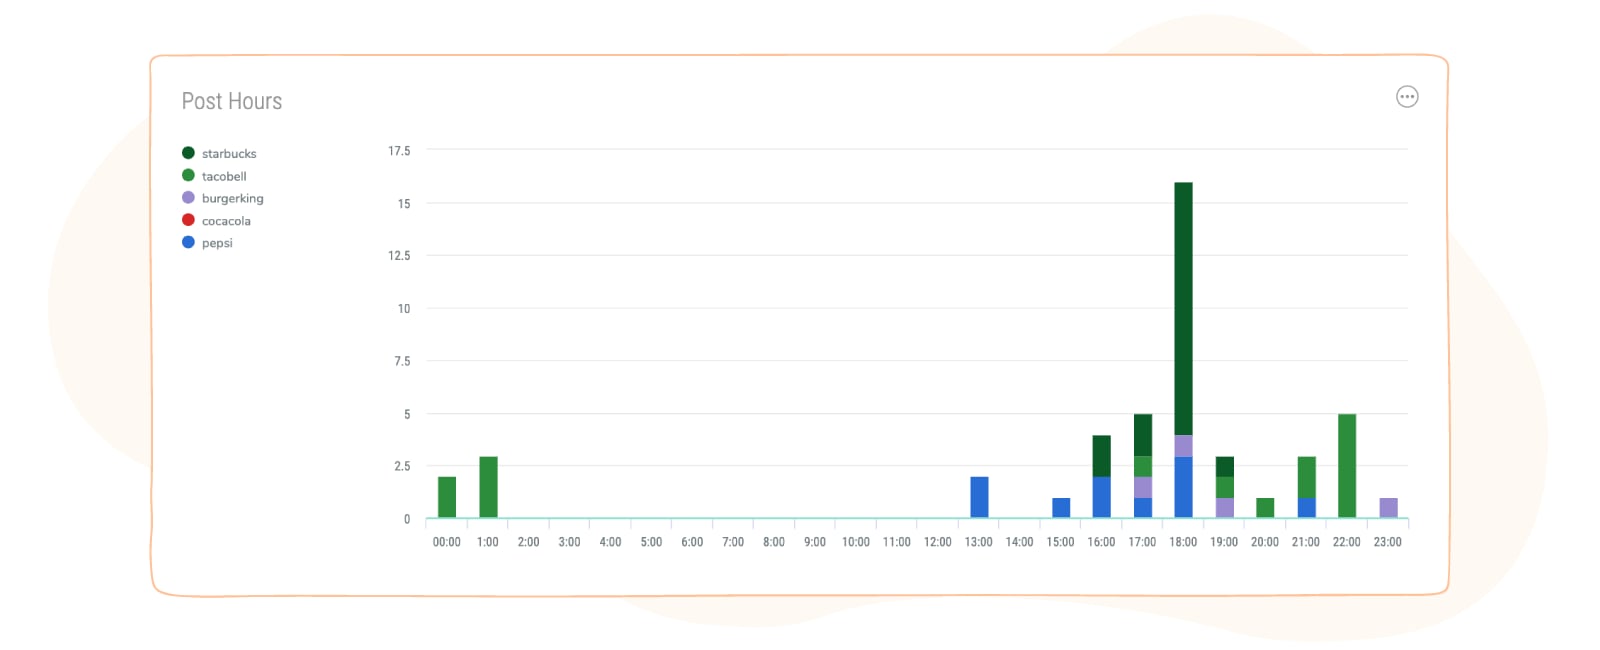
Also look at the days of the week your competitors post on Instagram, every day or only on specific ones, and look for patterns. Then take it to the next level and check the hours. This helps when you schedule your own content: see whether a post’s performance relates to the hour and day it went out.
How to monitor Instagram competitors’ growth
Track each competitor’s follower count on the same day every month and turn the change into a follower growth rate: new followers divided by the followers at the start, times 100. A percentage lets a 30,000-follower account and a 1-million-follower account sit in the same table.
Then look for spikes. Steady growth usually comes from a content strategy working; a sudden jump has a cause you can find. In October 2026, more than all of Rockstar Energy’s net gain for the month arrived on one day, 16 October, the day after it posted a ticket giveaway asking people to follow the account. CELSIUS grew fastest from 29 to 31 October, when it ran two promoted posts:
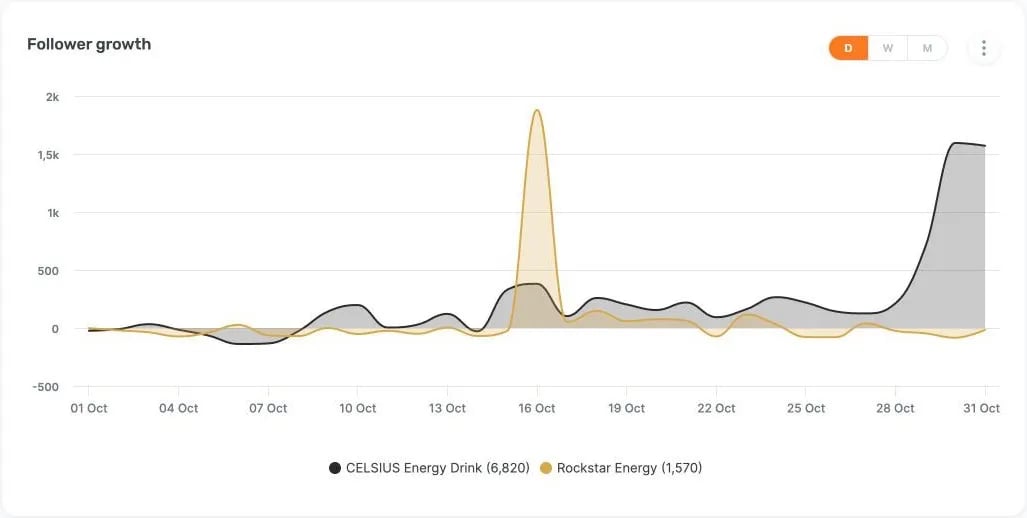
When you see a spike, check the competitor’s posts from the day before: a giveaway, a collab, a product launch or paid promotion. If you find nothing, a jump with no matching rise in likes and comments can point to bought followers, which inflate the follower count and drag the engagement rate down. That’s how you spot a growth trend early, instead of reacting to one viral post.
Analyze competitors’ engagement rates
The engagement rate is the most useful single number in a competitor comparison, as long as every account is measured the same way. Instagram doesn’t publish a formula; its Help Center only defines interactions (likes, comments, saves and shares) for your own content. So pick a formula your competitors’ public numbers can support:
| Formula | What it counts | Who can calculate it |
|---|---|---|
| Engagement rate by followers | (Likes + comments) ÷ followers × 100, per post | Anyone, competitors included |
| Reels rate by views | (Likes + comments) ÷ views × 100 | Anyone, for Reels only |
| Engagement rate by reach | (Likes + comments + saves + shares) ÷ reach × 100 | The account owner only |
Use the first one for the comparison, quote it per post, and say whether it’s an average or a median. Keep the second for Reels, because photos and carousels have no public view count. The third belongs in your own Instagram analytics report, never next to a competitor’s number. For the arithmetic on other networks, here’s how to calculate engagement rate.
Worked example: CELSIUS vs Rockstar Energy, October 2026
To show how much the method changes the answer, we compared two energy drink brands of almost the same size, CELSIUS and Rockstar Energy, for 1 to 31 October 2026, using public data from a Sociality.io competitor report. Engagements here are likes, comments and reposts, the way Sociality.io counts them; reposts are 1% to 3% of the total, so likes plus comments tell the same story.
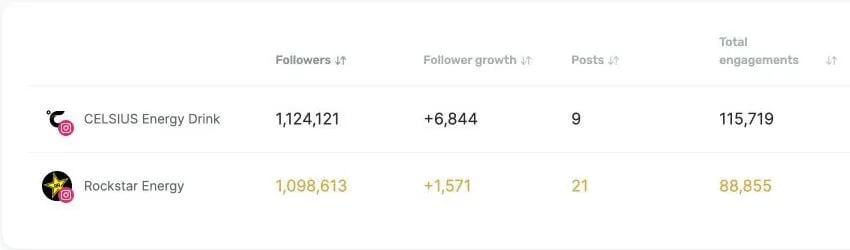
| October 2026 | CELSIUS | Rockstar Energy |
|---|---|---|
| Followers on 31 October | 1,124,121 | 1,098,613 |
| Follower growth | +6,844 (+0.61%) | +1,571 (+0.14%) |
| Posts | 9 (3 Reels, 5 carousels, 1 photo) | 21 (14 Reels, 5 carousels, 2 photos) |
| Engagements (likes, comments, reposts) | 115,719 | 88,855 |
| Engagement rate per post, average | 1.14% | 0.39% |
| Engagement rate per post, median | 0.47% | 0.14% |
| Organic engagement | 56,448 (49%) | 84,235 (95%) |
| Organic engagement rate per post, average | 0.56% | 0.37% |
| Reels rate by views, median | No view count returned | 3.54% (14 Reels, 2,285,942 views) |
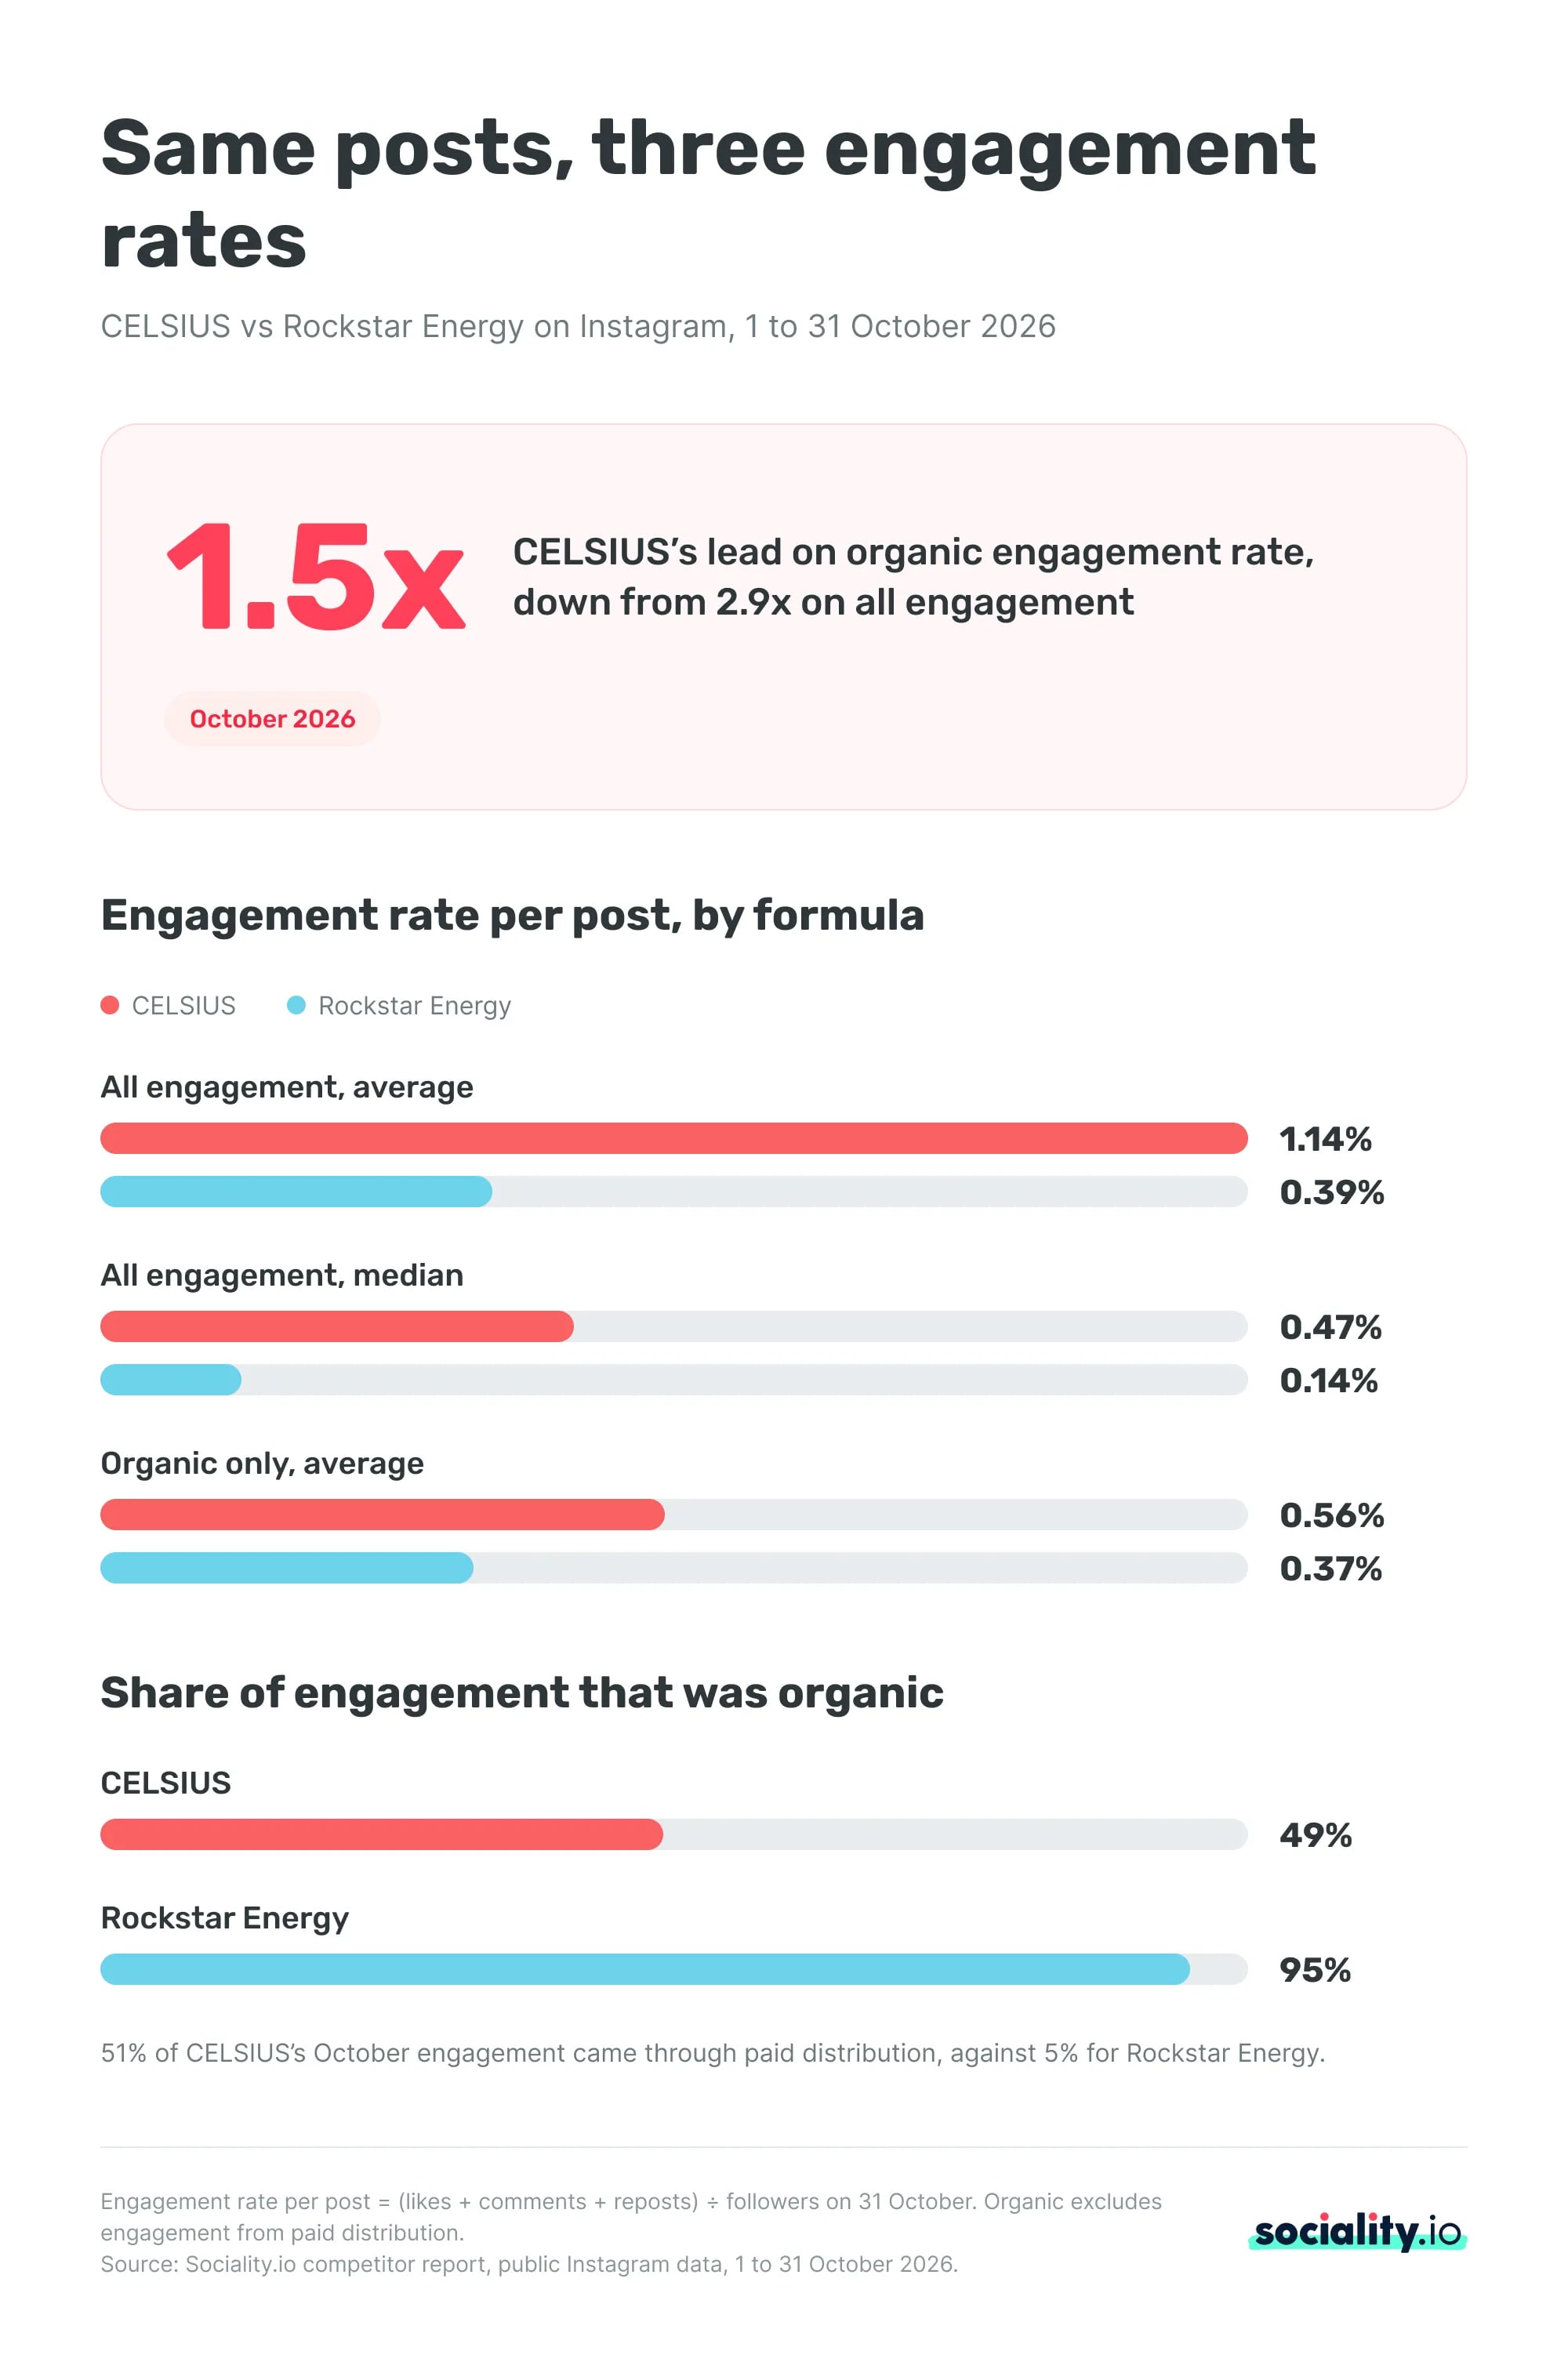
Read only the headline, and CELSIUS looks almost three times as engaging. Three things change that:
- Half of CELSIUS’s engagement was paid. Its top post, a Reel from 7 October with 38,540 likes and 907 comments, got 38,768 of its 39,459 engagements through paid distribution. Organic only, the gap falls from 2.9x to 1.5x.
- One outlier moves the average. CELSIUS’s median post (0.47%) sits far below its average (1.14%). Report both, or the median alone.
- Comments can be bought with a prize. Rockstar’s ticket giveaway on 15 October drew 4,008 of its 5,084 comments for the month, and its follower spike came the next day.
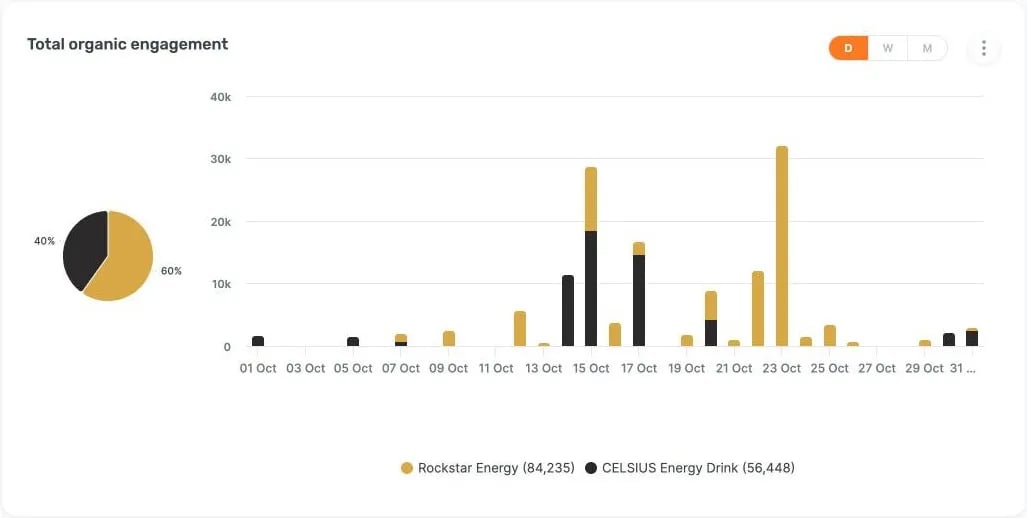
Rockstar posted more than twice as often (4.7 posts a week against 2.0), mostly Reels, and its median Reel earned 3.54 likes and comments per 100 views. CELSIUS’s Reels came back with no view count, so the views-based rate can’t be compared, and we left it blank rather than guess. One month and two accounts make this a method, not a benchmark for the energy drink category.
Instead of opening every report, you can ask an AI assistant for the same numbers each month.
Sociality MCP connects your social accounts to ChatGPT, Claude or Gemini, so you can ask about Instagram in plain language and get answers from your Sociality.io data. For example:
What are the top engaged posts of Redbull this month on Instagram?
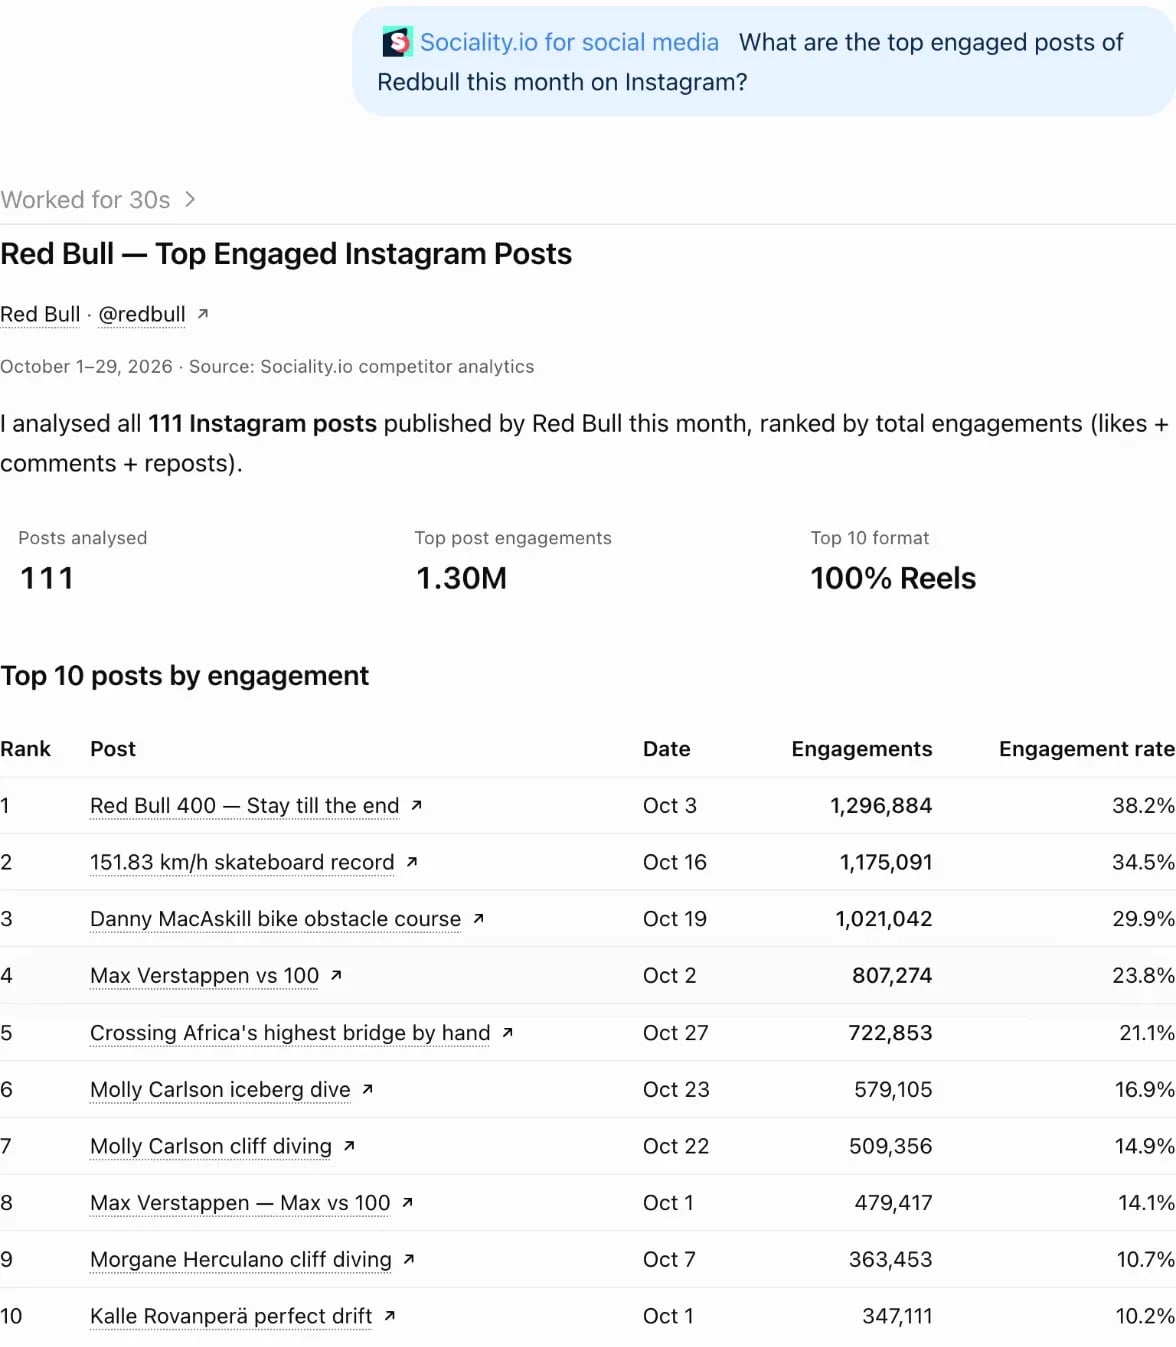
The answer comes back as a ranked table of the posts with their engagement and engagement rate, so you can see what works for a competitor without opening a single profile or exporting a spreadsheet.
Connect Sociality MCPFree to start: 1,000 credits, no credit card.
For prompts that turn those numbers into a written comparison, see our guide to competitive analysis with ChatGPT.
How to research competitors’ Instagram ads
Instagram ads don’t show up on a competitor’s profile, so go to the Meta Ad Library:
- Choose a country, or All, and set the ad category to All ads.
- Type the brand’s name and pick its Page from the Advertisers list, not the keyword results, which mix in other advertisers.
- Open Filters, set the platform to Instagram and the status to Active, or to All.
- Open an ad to see its start date, the platforms it runs on and, where a brand runs several versions, how many ads use the same creative.
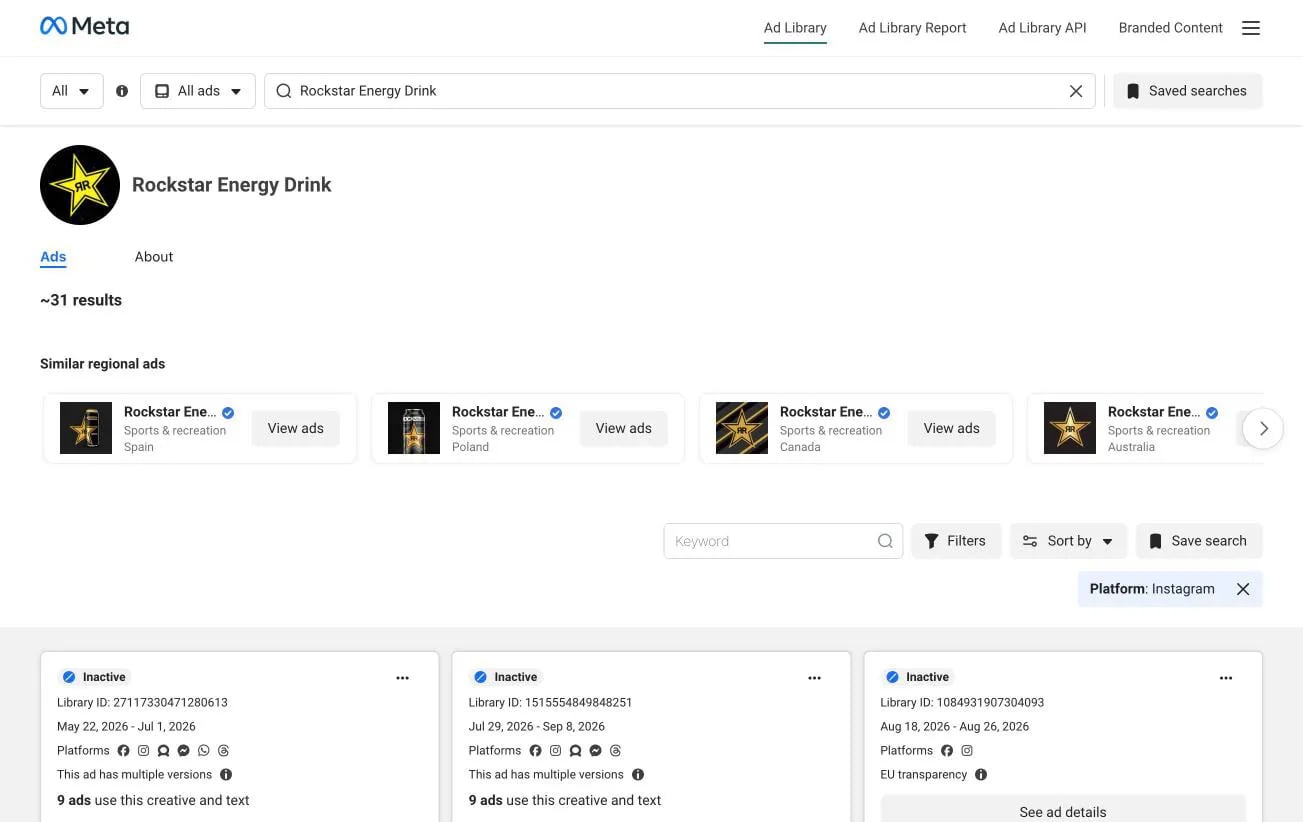
The library shows every advertiser’s active ads, but only political and issue ads stay searchable after they stop. Ads shown in the EU are the exception: since August 2023, Meta archives them for a year with the dates they ran and the targeting used. So check the country filter before you conclude a brand isn’t advertising: on 11 November 2026, the United States view showed no ads for Rockstar’s main Page, while All countries listed about 31 Instagram ads, inactive EU ones included. The library doesn’t show spend or results for ordinary ads. To see which of a competitor’s organic posts they boosted, track competitors’ promoted posts.
How competitors’ content strategy changes over time
It’s a good idea to study how a competitor’s Instagram page has changed over time. Scroll back a year in their grid and compare it with this month: the formats, the share of product posts, who appears in them and how captions are written. Approaches they dropped are useful too, because they show you what didn’t work before you test it yourself.
For example, Nike’s Instagram is worth a scroll: compare its grid from a few years ago with this month and note how much of it shows products, athletes or causes. Shifts like that often follow Instagram itself: Meta says it raised the prevalence of original content on Instagram in the US by 10 percentage points in the last quarter of 2025, so accounts that relied on reposts have had reasons to change.

How to turn it into an Instagram competitor report
A competitor report should answer one question for your manager or client: how do we compare on Instagram this month, and what will we test next? Keep it to one page:
- Scope: the accounts, why each is on the list, and the date range.
- Scorecard: followers, growth rate, posts per week, engagement rate per post (average and median) and Reels rate by views, for every account including yours.
- Top posts: the best two or three posts per competitor, with links, and why they worked.
- Ads: what each competitor is running in the Ad Library, and since when.
- What changed: spikes, new formats, campaigns and hashtags.
- Tests for next month: two or three, each with an owner and a date to check it.
Pull the numbers on the same day each month and keep a note of what you can’t see, such as hidden likes or missing view counts. For more ways to set targets from the comparison, see these competitive benchmarking tactics, and when the report goes to leadership, here’s how to explain social media reports to C-levels.
To save you the setup, we made a free Instagram competitor report template. It has a monthly log for each account, the scorecard with the formulas filled in, and tabs for top posts, ads and tests. The companies in it are made-up examples, so type over them with your own. It works in Excel, Google Sheets and Numbers.
And that’s a wrap!
That’s it. You now have the checklist, the formulas and a template to run your first Instagram competitor analysis, and the habit that makes it useful is doing it again next month with the same accounts and dates. We hope this guide saves you as much time as it took us to put the numbers together. Check out our series on social media competitor analysis below:
- How to conduct a competitor analysis on Facebook
- How to run a LinkedIn competitor analysis
- Top 5 social media competitor analysis tools
FAQs about Instagram competitor analysis
Is there a free Instagram competitor analysis tool?
Instagram itself is the free option: every public profile shows followers, posts, likes and comments, and Meta AI can benchmark your account against similar brands, free to start. For a monthly report across several accounts, Sociality.io compares up to 15 Instagram competitors with a 14-day free trial, and Sociality MCP lets ChatGPT, Claude or Gemini answer questions about them, starting with 1,000 free credits.
Can I see a competitor’s Instagram reach?
No. Reach, along with saves, shares, profile visits and follower demographics, appears only in the account owner’s Insights. No public profile, Meta tool or API shows it for another account. For competitors, compare what is public instead: followers, posts, likes, comments and Reels views, all for the same date range.
How do I compare engagement rates with competitors?
Use the same formula for every account: likes plus comments, divided by followers, times 100, calculated per post for the same dates. Report the median as well as the average, because one viral or boosted post can inflate the average. Compare Reels separately by views, and leave reach-based rates for your own account, since competitors’ reach isn’t public.
Can I see a competitor’s Instagram Reels views?
Usually, yes. Reels show a view count on the account’s Reels tab, and Instagram’s Business Discovery API returns Reels views for other professional accounts, paid and organic combined. Photos and carousels have no public view count, and owners can hide likes, so compare Reels by views only against other Reels.
How do I see the Instagram ads my competitors run?
Search the Meta Ad Library, pick the competitor’s Page from the Advertisers list and filter the platform to Instagram. It shows every advertiser’s active ads with start dates and platforms. Inactive ads stay searchable only for political and issue ads, and for ads shown in the EU, which Meta keeps for a year. Spend isn’t shown.
What is Instagram competitor analysis?
Instagram competitor analysis is comparing your Instagram account with rival accounts on followers, growth, posting, formats and engagement, then studying their top posts and ads to explain the differences. Done monthly with the same metrics and dates, it shows what is realistic in your market and which content your shared audience responds to.