
A Facebook competitor analysis compares your Page with rival Pages on followers, posting, formats and engagement, then studies their content and ads to explain the gaps. It’s an inseparable part of a social media marketing strategy: not only does it let you set accurate benchmarks, it also lets you learn from competitors’ successes and failures on a network with more than 2 billion daily users.
Conducting a competitor analysis on Facebook by hand is time-consuming, though. So in this article, we’ll cover what Facebook shows you about other Pages, which numbers compare fairly, a worked example from October 2026 and a free report template, along with the tools that save your social media team’s time.
TL;DR: Facebook competitor analysis in five points
- Meta removed Page likes and focused Pages on followers in 2021, so followers are the audience number to compare.
- Business Suite Insights compares your Page with businesses in your category and keeps a Businesses to watch list. Meta AI can benchmark you against similar brands, free to start.
- A competitor’s reach, link clicks and demographics stay private. Compare reactions and comments per post against followers, with one formula for every Page.
- The Meta Ad Library searches every advertiser’s active ads by keyword or Page. Spend appears only for political and issue ads.
- In our October 2026 example, Burger King’s average engagement rate was three times McDonald’s. One video made 85.4% of its month, and the median put McDonald’s ahead.
Competitors’ Facebook Page analysis
Knowing your competitors is important for business development. This goes beyond having a simple list with your competitors’ names. The complete analysis should include information on what your competitors are doing, why they are doing them, and where their strategies will likely lead to.
Analyzing how other companies position their products and attract customers is important for building up your own marketing strategy.
Studying your competitors’ Facebook Pages is not a one-time action. Facebook marketing strategies are dynamic and adapt to ongoing market changes.
This helps you benchmark your social media marketing results against your competitors so that you will know how well you are doing, can identify growth opportunities, and even build a better Facebook marketing strategy for your business.
During this analysis, you collect and process data on your competitor’s activities on Facebook either manually or with the aid of a tool like Sociality.io’s Facebook competitor analysis.
Why conduct a Facebook competitor analysis?
It helps you understand your audience
A business is considered a competitor when you offer similar products or services and thus, target the same audience. Through competitor analysis, you can analyze how your competitors communicate with your audience, their tone, and the frequency of their communication.
Understanding what sort of content drives engagements among your audience helps you recognize their needs and desires. This is so important because if you don’t understand the wants and needs of your audience as it concerns your product or service, there is little chance that your content will get the desired response.
It allows you to benchmark your results against those of your competitors
An increase in the number of your followers or in the average number of comments you get per post is great, but how great are those numbers compared to those of your competitors? You can only know this through competitor analysis.
Benchmarking your results against that of your competitors helps you to put your results into perspective so that you’ll know how well you are doing in your industry and if your progress is in line with your social media goals.
It helps you avoid making the same mistakes as your competitors
Social media marketing sometimes requires you to be daring and to take risks. Sometimes, however, things don’t go as planned on paper, and this can happen to your competitors as well. There may be gaps in their strategies, and they may have made mistakes that you can avoid just by monitoring their social media activities.
Notice which campaign or content didn’t match up to expectations and those that they had to stop or tweak to suit your audience, and avoid repeating the same mistakes. When you do this, you can satisfy your audience more and take more informed risks whenever you need to.
It helps you build a more complete content strategy
Although you won’t have all the details of your competitors’ social media content strategy, competitor analysis, when done right, can give you most of the information you need: content types, the formats they promote, how often they post and how consistent they are. You can get all this information ethically from your competitors’ social media pages.
When you capture your competitors’ strategy, you can then evaluate it using the audience’s response to their content. You can then use this information to create a more focused social media strategy better suited to your audience.
What Facebook and Meta show you about competitors
Before you pick competitors or open a spreadsheet, it helps to know what Facebook gives you for free, what Meta’s own tools add, and what nobody outside a Page can see.
On a competitor’s Page
A public Page shows its follower count and its posts, each with a date, a format and its reactions, comments and shares. Reels usually show a view count too. There’s no separate Page likes number anymore: in 2021, Meta removed likes and focused Pages on followers, the people who can receive a Page’s updates.
Page transparency tells you who’s behind a Page. Click the Page name under the cover photo, then Transparency and privacy policy, and Facebook shows when the Page was created, which countries it’s managed from and by how many people, its earlier names, any merges since 6 September 2018 and, where they apply, a confirmed Page owner or a state-controlled media label. The same details sit next to the Page’s ads in the Ad Library.
Business Suite: compare with businesses in your category
For your own Page, Meta Business Suite Insights can show how you compare with other businesses in the same category: how much content similar businesses create and how many followers they have. You can also build a Businesses to watch list to follow specific Pages in your category. It’s free, but it compares content volume and followers, so you still need the posts themselves to explain a difference.
Meta AI benchmarking
Meta AI can benchmark your business against similar brands by analyzing their public content and engagement patterns on Facebook and Instagram, and Meta says it’s free to get started. We’d treat it as a quick first read and check what it tells you against the Pages themselves. Meta One’s Competitive insights, the paid competitor dashboard Meta launched in September 2026, is an Instagram creator feature, and Meta doesn’t document it for Facebook Pages.
What nobody outside the Page can see
Reach, link clicks, Views on photo and text posts, follower demographics and ad results stay in the Page owner’s Insights. When Facebook replaced impressions and Plays with Views in November 2024, reach stayed the same, and it’s still private. So a competitor comparison works with public numbers and treats everything else as unknown.
Shortcuts are limited too. CrowdTangle stopped working on 14 August 2024, and its replacement, the Meta Content Library, is open only to eligible researchers. Scraping isn’t a way around it: Meta says that using automation to collect Facebook data without its permission violates its terms.
The simplest way to start monitoring your Facebook competitors
Step 1: Choose your competitors for analysis.
You probably already have an old drive document on changes happening in the market that is collecting virtual dust somewhere in your “Marketing” folder. Bring it back to life and update it.
Note that your Facebook competitors differ from your regular business competitors. On Facebook, you are fighting for audiences’ attention.
Facebook competitors are categorized as direct and indirect.
Direct competitors offer a product or service similar to yours. For example, all tea producers are direct competitors to each other. That’s easy.
Indirect competitors produce a product that can replace yours. For example, coffee or cocoa producers are indirect competitors of the tea industry. However, on top of that, bloggers and celebrities whose audiences’ demographic characteristics are similar to those of yours are also your Facebook competitors.
Why? Here’s how it works. Bloggers, celebrities, and tea/cacao/coffee producers are all competing for the top of their audiences’ Feed. If your content outperforms that of other tea producers, it still has to earn its place next to the bloggers and celebrities your audience follows, and your own Facebook analytics show which of your posts manage it.
Thus, take the above advice and update your old competitors’ documents.
Step 2: Start by collecting simple metrics on one spreadsheet.
Go to each of your competitor’s Facebook Pages and collect data there, on the same day for every Page. Since Meta’s New Pages Experience, a Page has followers rather than likes, so followers are your audience number. Following a Page doesn’t mean seeing all of its posts, though: Feed is ranked, which is why engagement per post tells you more than the follower count alone.
Here’s what you can collect for a competitor, and what only the Page owner sees:
| Metric | Your Page | A competitor’s Page | How to compare fairly |
|---|---|---|---|
| Followers | Insights | On the Page | Same date for every Page; growth as a percentage |
| Posts and formats | Insights | Count the posts | Posts per week, split into Reels, photos, albums, links and text |
| Reactions, comments, shares | Insights | On each post | Per post, same calendar month, posts at least two days old |
| Reels views | Insights | On each Reel | Reels against Reels only |
| Reach, link clicks, Views on photo and text posts | Insights | Not available | Your own trend only |
| Follower demographics | Insights | Not available | Read who comments, by hand |
| Ads | Ads Manager | Meta Ad Library: creative and dates | Creative and timing, never spend |
If you use only the data from Facebook, your sheet ends up with each competitor’s name, Page link, followers, the engagement rate of their recent posts, links to their most engaged content (called “unicorn content”) and recent ad examples. For growth over time, record followers on the same date each month and work out each Page’s follower growth rate.
How to measure Facebook competitors’ engagement rates
Since it’s tough to gather and calculate engagement data manually, we suggest a fixed window: every post each competitor published in the same calendar month. This will give you a fresh insight into how brands are currently doing on social media, and a quiet Page and a busy one are judged on the same days.
Note: Don’t use posts that were very recently posted, like an hour or a day ago. Use posts that have been posted at least two days ago.
Gather the number of total reactions and comments that each post got and use the formula below to calculate the engagement of each post separately.

The result shows a post’s reactions and comments as a percentage of the Page’s followers. It’s a comparison measure rather than a share of real people, since people who don’t follow the Page react too, and Meta doesn’t publish an engagement-rate formula for other Pages, so say which one you used.
Pro tip: we recommend reporting the median post next to the average, because one hit can lift the average a long way. Keep shares in their own column, and compare Reels with Reels by views. For the arithmetic on every network, here’s how to calculate engagement rate, and for what Views and reach mean on your own Page, see reach vs. impressions.
Worked example: McDonald’s vs Burger King, October 2026
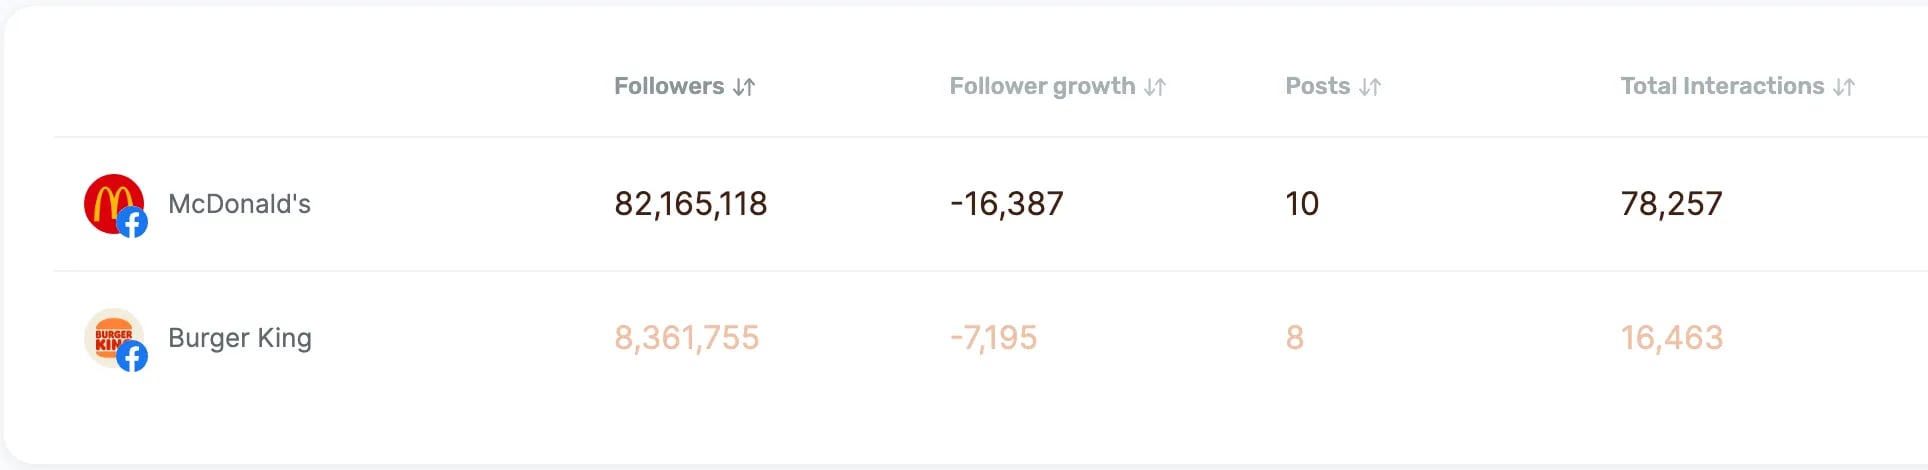
To show what the method changes, we compared two burger chains’ public Facebook Pages for 1 to 31 October 2026, using a Sociality.io competitor report. Engagements here are reactions, comments and shares, the way Sociality.io counts them, while the engagement rate counts reactions and comments only, per post, against followers on 1 October.
| October 2026 | McDonald’s | Burger King |
|---|---|---|
| Followers on 1 October | 82,181,505 | 8,368,950 |
| Follower change | -16,387 | -7,195 |
| Posts | 10 (4 photos, 3 albums, 2 text, 1 video) | 8 (7 videos, 1 album) |
| Engagements (reactions, comments, shares) | 78,257 | 16,463 |
| Engagements per post, average / median | 7,826 / 5,540 | 2,058 / 366 |
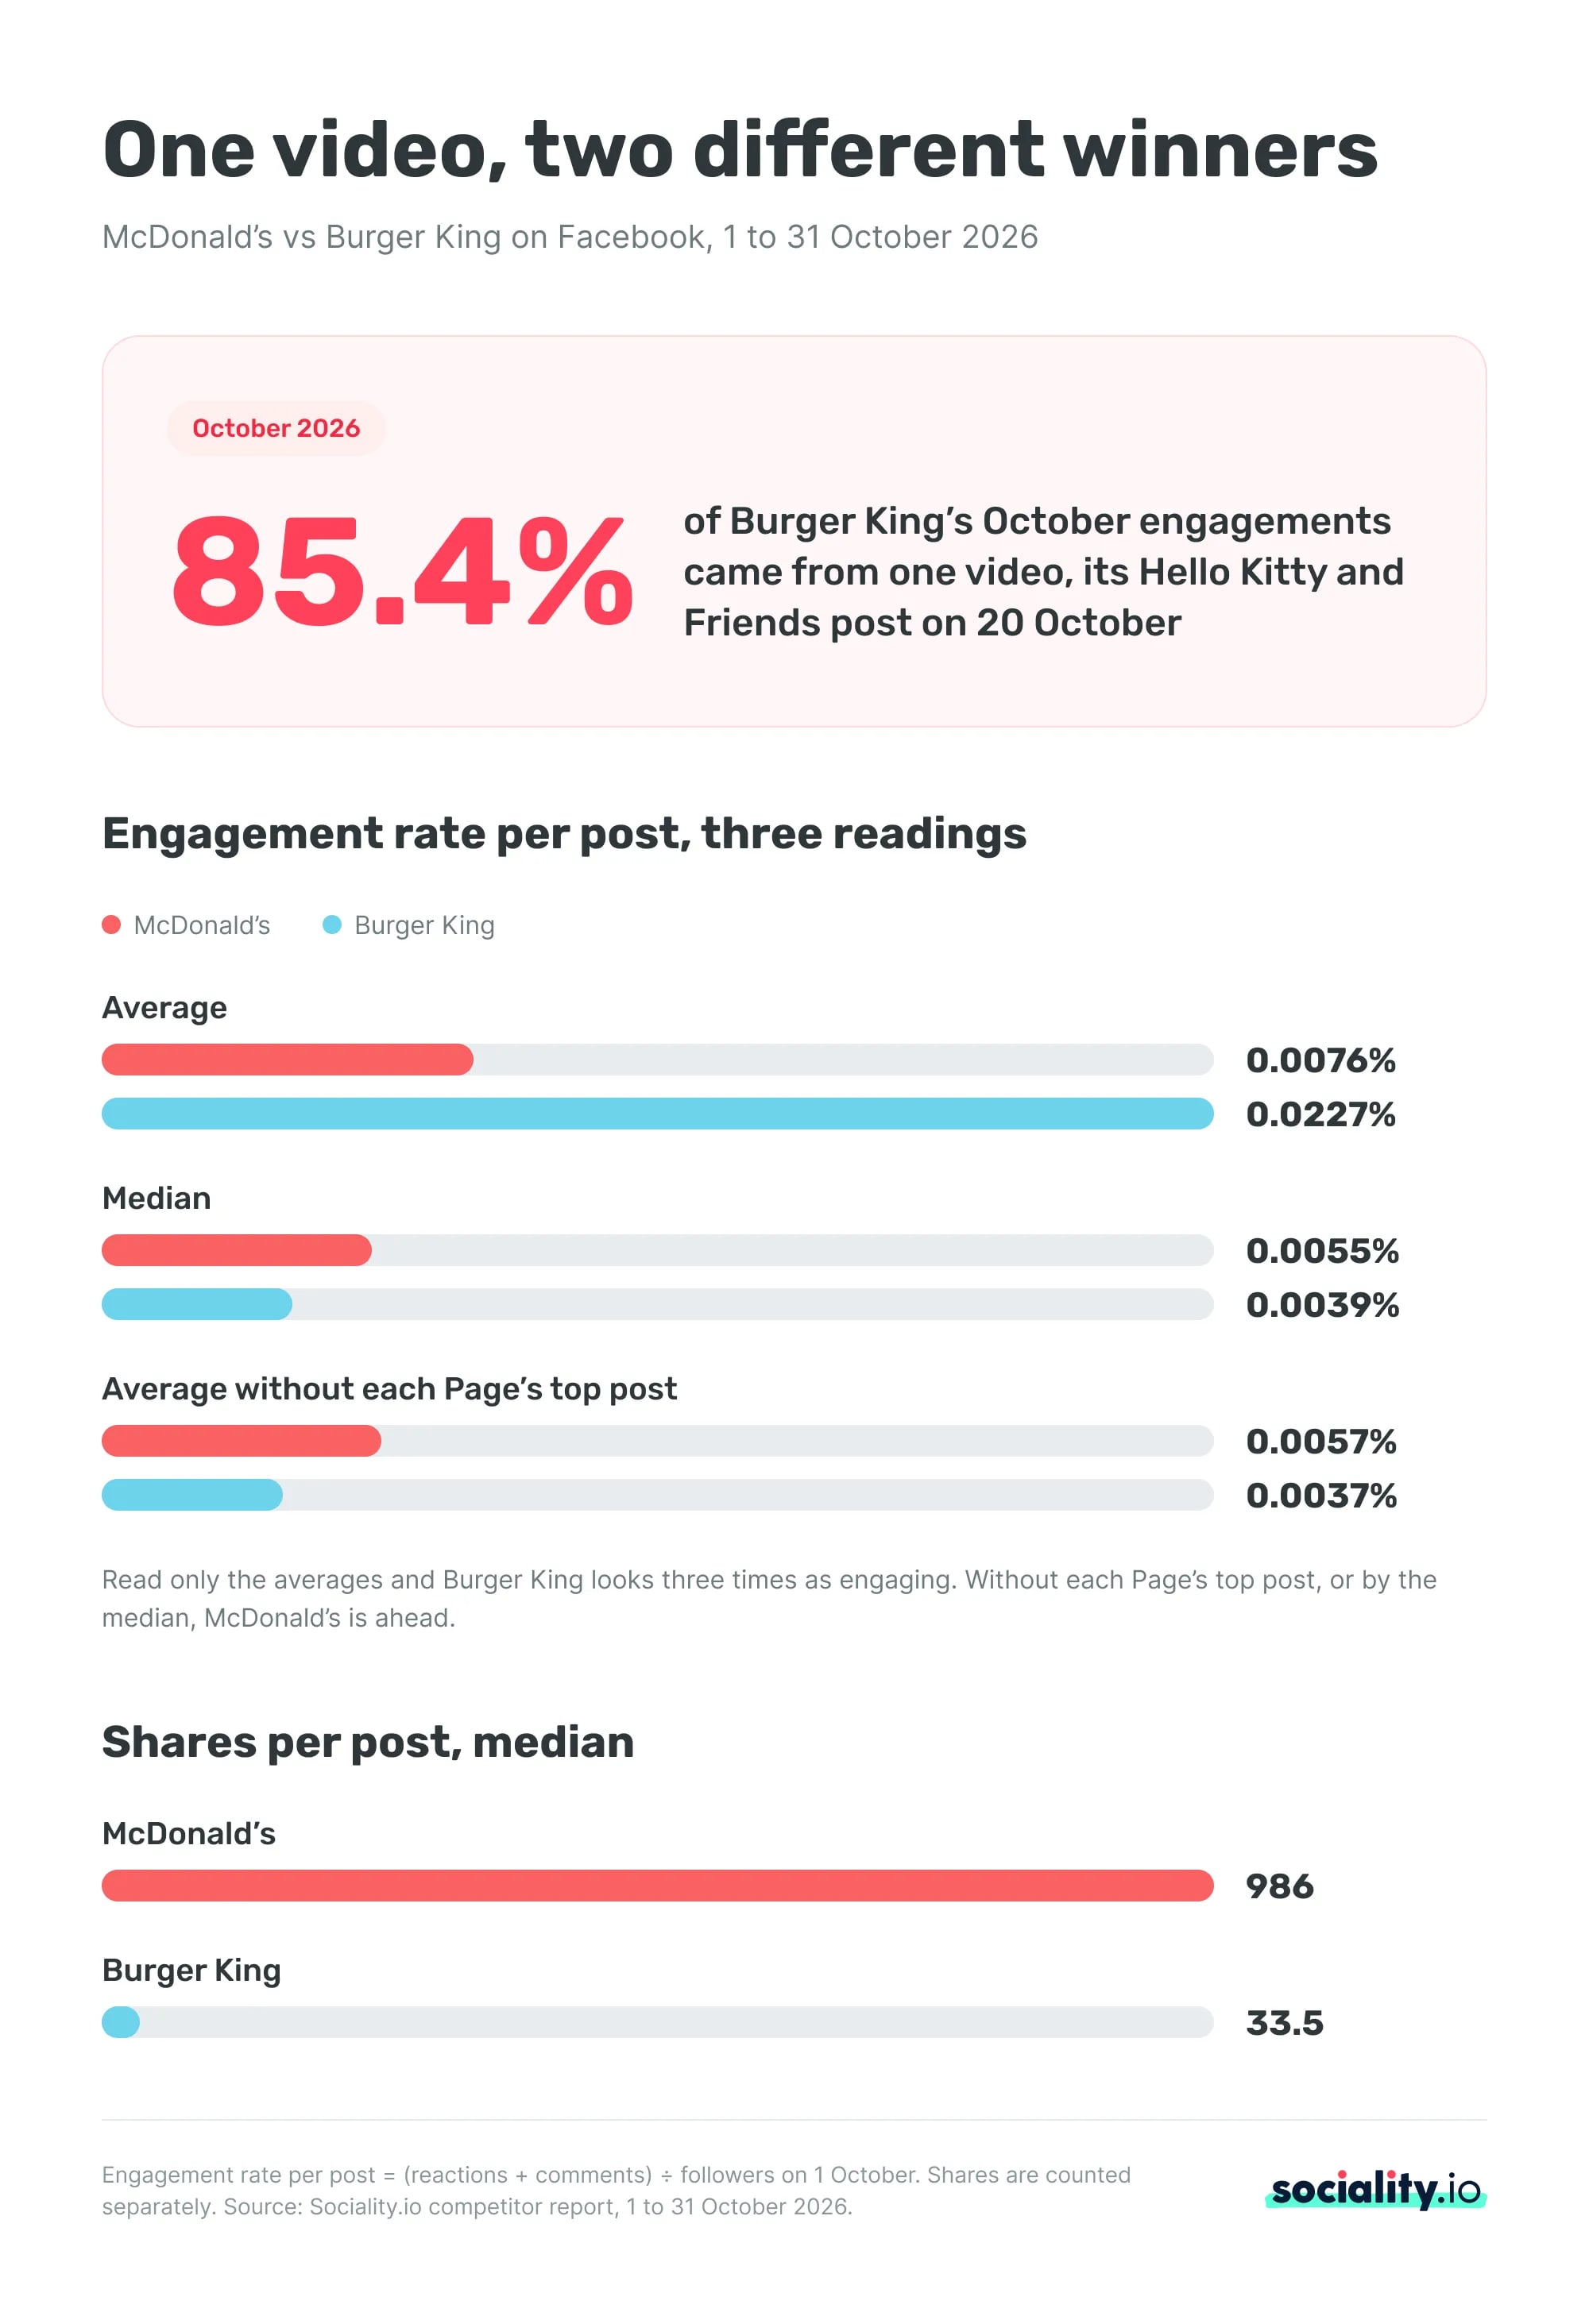
| Engagement rate per post, average | 0.0076% | 0.0227% |
| Engagement rate per post, median | 0.0055% | 0.0039% |
| Average without each Page’s top post | 0.0057% | 0.0037% |
| Top post’s share of the month’s engagements | 33.5% | 85.4% |
| Shares per post, median | 986 | 33.5 |
Read only the averages, and Burger King looks three times as engaging. Three things change that:
- One video made the month. Burger King’s Hello Kitty and Friends video on 20 October earned 14,059 engagements, 85.4% of the Page’s October total and 38 times its median post. Without it, Burger King’s average falls from 0.0227% to 0.0037%, below McDonald’s 0.0057%.
- The median flips the ranking. McDonald’s median post (0.0055%) beat Burger King’s (0.0039%). McDonald’s best post, a holiday drinks photo on 27 October with 26,179 engagements, was 4.7 times its median, so its average moved far less.
- Shares tell their own story. McDonald’s median post was shared 986 times and Burger King’s 33.5, a gap that a reactions-plus-comments rate never shows.
Burger King’s followers fell on every day of October except 21 October (+382) and 22 October (+1,246), the two days after the video. That’s a timing match, not proof that the video caused it. One month and two Pages make this a method, not a benchmark for burger chains.
We pulled these numbers through the Sociality.io MCP server, which lets ChatGPT, Claude or Gemini read the Facebook competitors you track in Sociality.io, so next month you can ask for them in a chat instead of copying them by hand.
For prompts that turn the numbers into a written comparison, see our guide to competitive analysis with ChatGPT.
What is a unicorn Facebook post?
A unicorn Facebook post is content that outperforms others by showing higher than average engagement rates. Burger King’s Hello Kitty video in the October 2026 example is one: a single post with 85.4% of the Page’s monthly engagements. You can manually analyze it by comparing reactions, comments and shares from post to post, and it’s worth logging every unicorn on its own line in your report rather than inside the average.
Understanding what content drives results is essential to your brand’s successful Facebook marketing strategy. However, you won’t be able to test all hypotheses and experiment results alone. Your competitors are already doing their best to reach an audience similar to yours. Why not learn about their successes and failures? Here’s how to find your unicorn content on your own Page too.
Step 3: Analyze your competitors’ Facebook content strategy.
This step is prone to subjective conclusions. Unless you have access to your competitors’ documents that state their content strategy, you can only intelligently guess what is happening behind closed doors.
Here is a list of questions you should answer:
- How often do your competitors post on Facebook?
- What time do they post?
- What content do they post the most? (These can be text or status updates, photos, albums, Reels, Live videos, events or links to more information. Facebook now publishes videos as Reels, so count them together.)
- Which posts have your competitors boosted or used for ads? A sudden spike in engagement can mean paid distribution, but it isn’t proof, so check the Page’s active ads in the Meta Ad Library before you call a post promoted.
- Do your competitors answer their users’ comments? How long does it take them to do so?
- Do they post user-generated content? What strategies do they use to encourage their users to post such content?
- What hashtag strategy do they use? Do they have branded hashtags?
- Do they offer giveaways or contests?
- What emoji do they commonly use?
- How much of their content is original? Meta prioritizes original content in Feed and Reels and reduces the reach of unoriginal posts, so a Page built on reposts may be losing distribution.
Save time with automatically generated competitor analysis reports.
If you don’t want to do your competitor analysis manually, you can use a tool like Sociality.io to create a Competitor Report for Facebook. It compares up to 15 Pages in one report and keeps the posts behind every number, so you can check what drove a result.
There are quite a number of software companies that provide the competitor analysis feature. Here’s our comparison of the top social media competitor analysis tools, and you can compare the prices of 32 social media management tools side by side. You’ll find out that these costs are often not what they seem to be.
How to run Facebook ads competitor analysis
Go to Meta Ad Library.
Meta opened Ad Library to all active ads in March 2019; before that, it held only ads about politics and issues. Today, anyone can search the ads currently running across Facebook, Instagram and Meta’s other apps:
- Choose a country, or All, and set the ad category to All ads.
- Type your competitor’s name and pick its Page from the Advertisers list. Keyword search now works for every ad category, but keyword results mix in other advertisers, so the Page is the cleaner view.
- Open Filters to narrow the ads by platform, media type, active status and date.
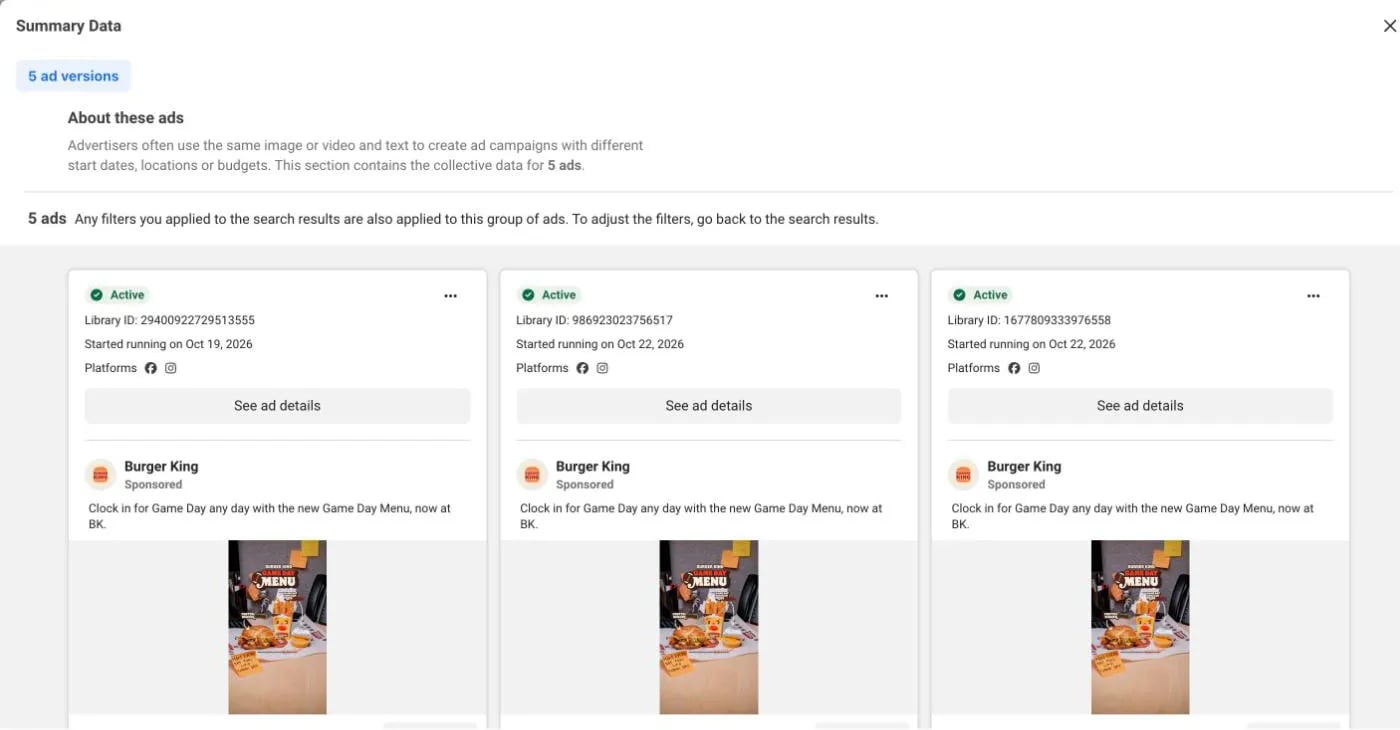
- Open an ad’s details to see when it started, where it runs and, when a brand runs several versions, how many ads use the same creative and text.
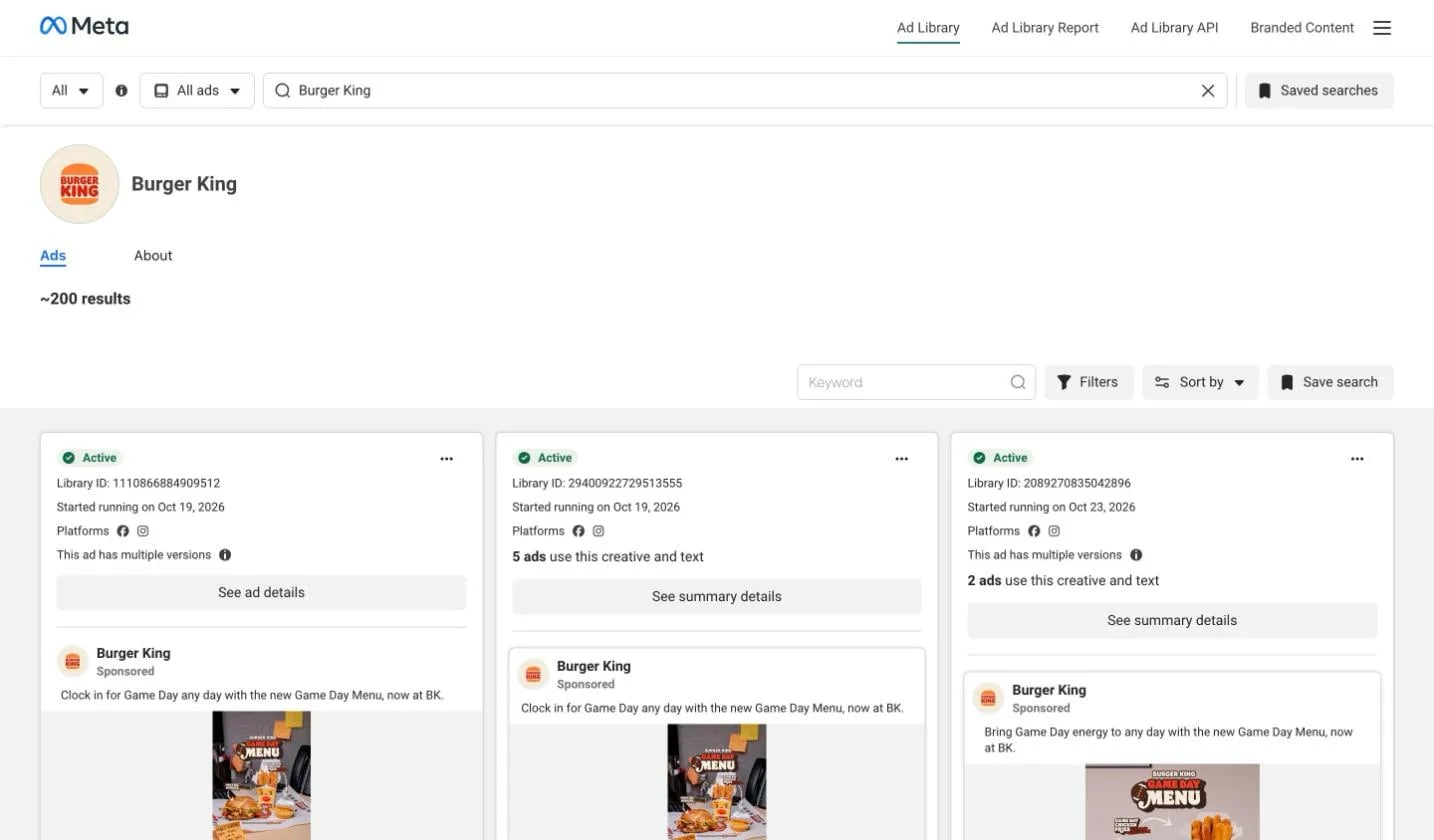
Note the message, the offer, the creative and how long each ad has been running. On 11 November 2026, the library listed about 200 results for Burger King’s Page, and one of its October ads ran in five versions with the same creative and text.
The library also has a branded content search for posts, stories, videos and Reels that involve a paid partnership, which helps when a competitor works with creators.
What the Ad Library doesn’t show
Know its limits before you report on it. For ordinary ads, only currently active ones are searchable. Ads shown in the EU are the exception, archived for a year, and so are UK ads that ran after 1 July 2025, while ads about social issues, elections or politics stay for seven years. A new ad can take up to 24 hours after its first impression to appear. Spend ranges, and the spending totals in the Ad Library Report, cover only those political and issue ads, so you can’t read a competitor’s budget or results for its commercial campaigns.
Meta Ad Library is still a great tool that makes it easier for you to work with competitor ads. It gives enough insights to discover your missed opportunities and to learn from your competitors’ successes.
If you want to automate metrics collection on competitors’ promoted posts, see how to track your competitors’ promoted posts.
Automate with a Facebook analysis tool
Sociality.io is a tool that transforms your competitors’ data to your advantage.
Inside Facebook Competitors Report, you get different metrics that can help you understand better your competitors’ presence on Facebook and their results. No manual labor is needed!
You can add up to 15 Pages to one report. Sociality.io tracks their followers from the day you add them and back-fills their last 100 posts; earlier data isn’t available. The report covers followers, Page posts, engagement and the posts themselves, and the screenshots below compare McDonald’s and Burger King for October 2026.
Followers
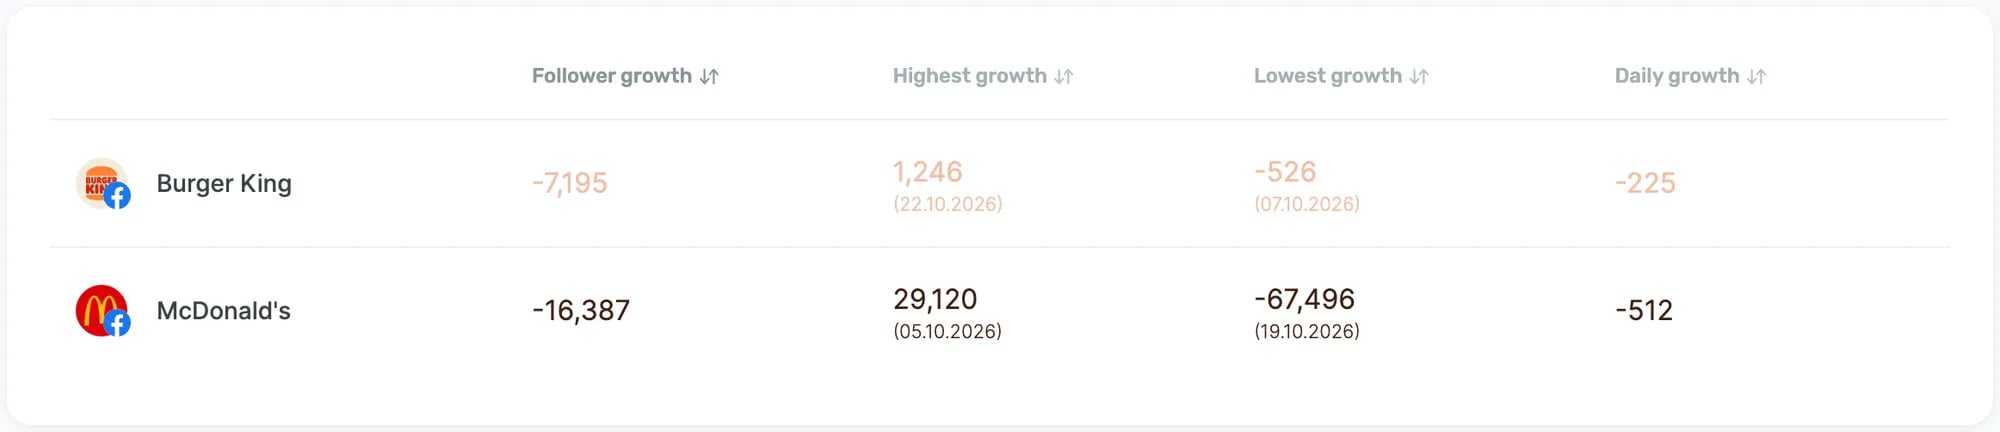
The followers report helps you understand how effective your competitors are in growing their audience on Facebook compared to you. It shows each Page’s net change, its best and worst day and its daily average, which can help you adjust your goals to make them realistic for your market.
Page Posts
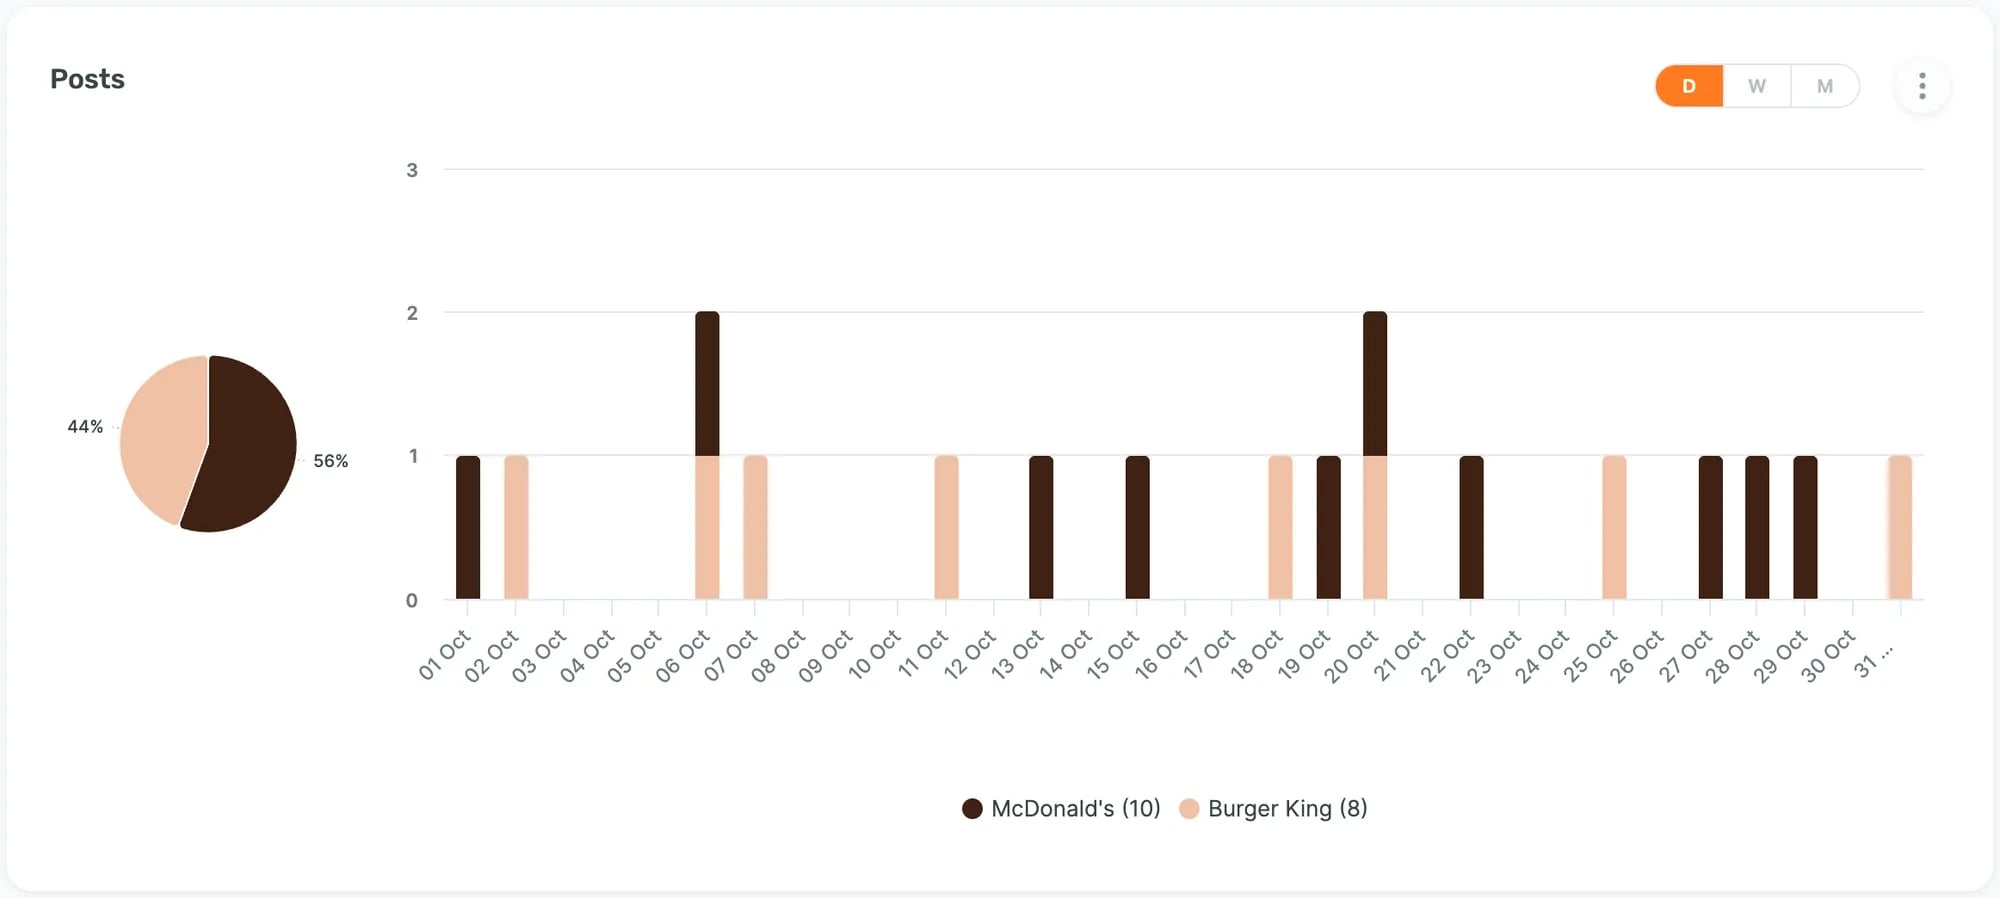
The Page Posts report shows the activity level of each of your competitors: how often they post and what type of content they share the most (photos, albums, videos, or text-only posts). The data from the report will help you adjust better your social media content strategy to that of your competitors.
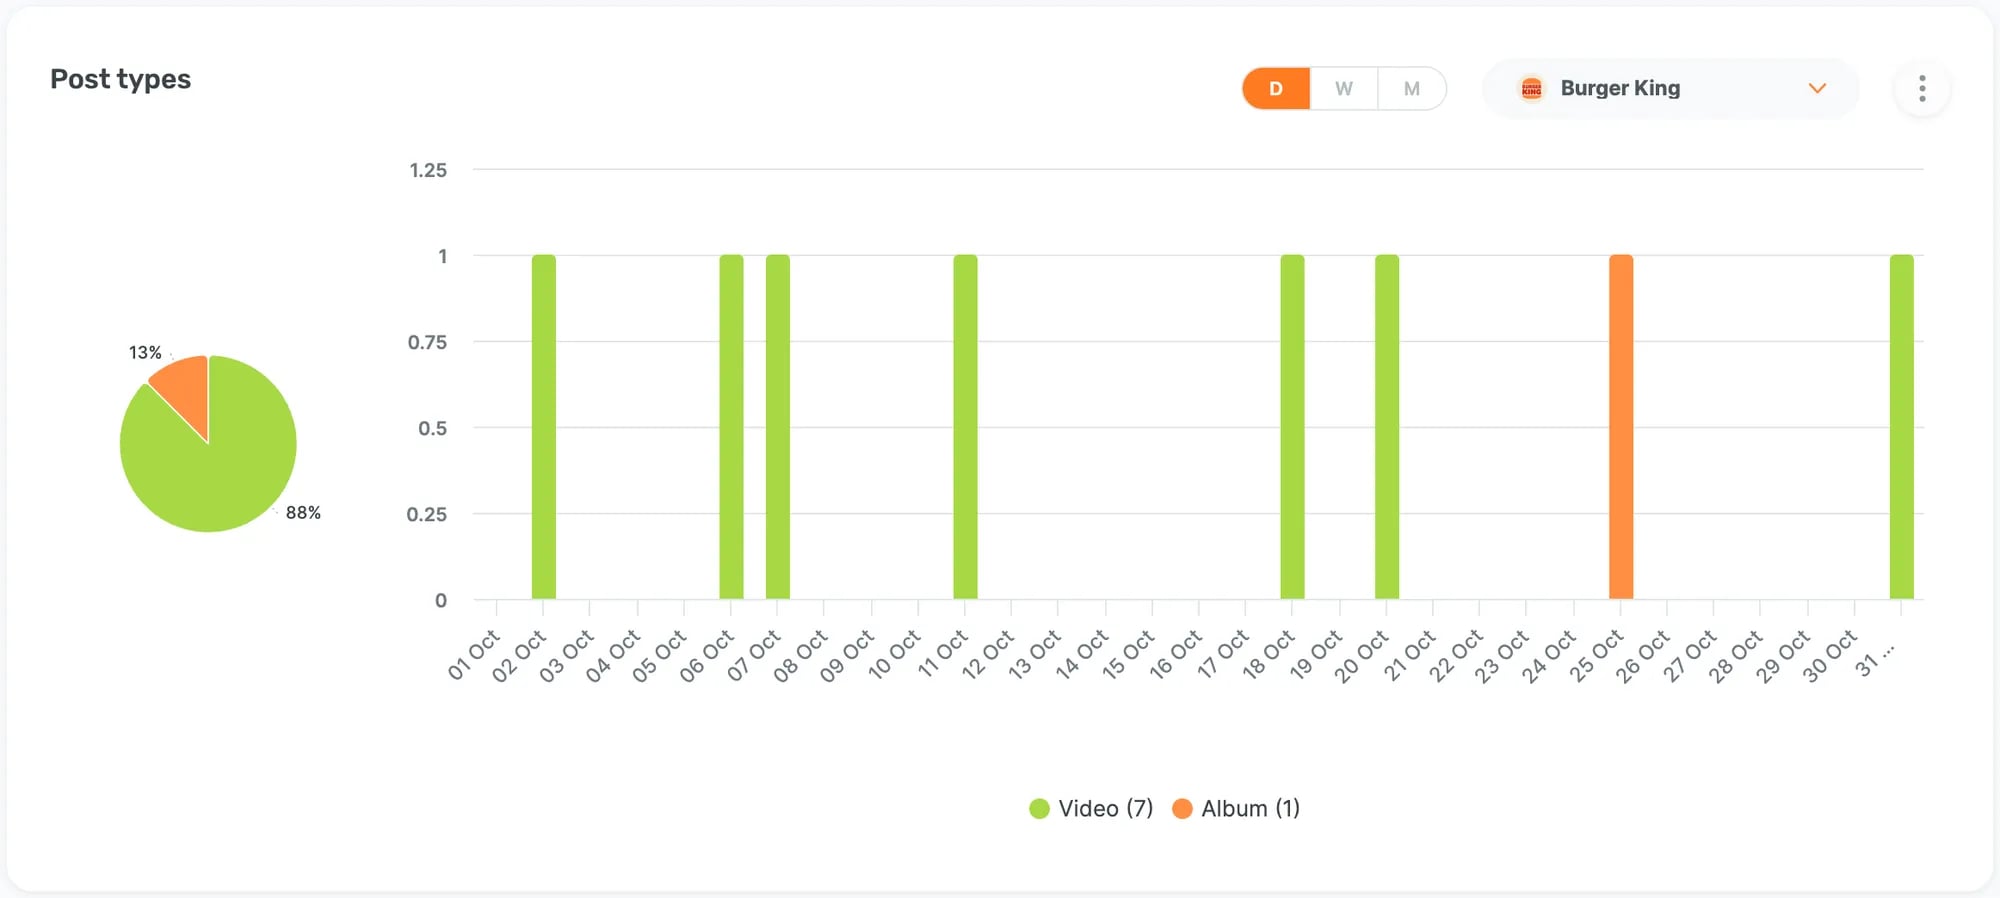
Specifically, Page Posts shows how many posts each of your competitors are posting either weekly or monthly.
The Post Types chart shows how much media a specific competitor is using in its Facebook posts.
Post Days and Post Hours are self-explanatory, but make sure to take a close look at these metrics as well to see if there are any patterns. Make sure to examine things like if your competitors post holiday messages and how they time promotional posts.
Engagement
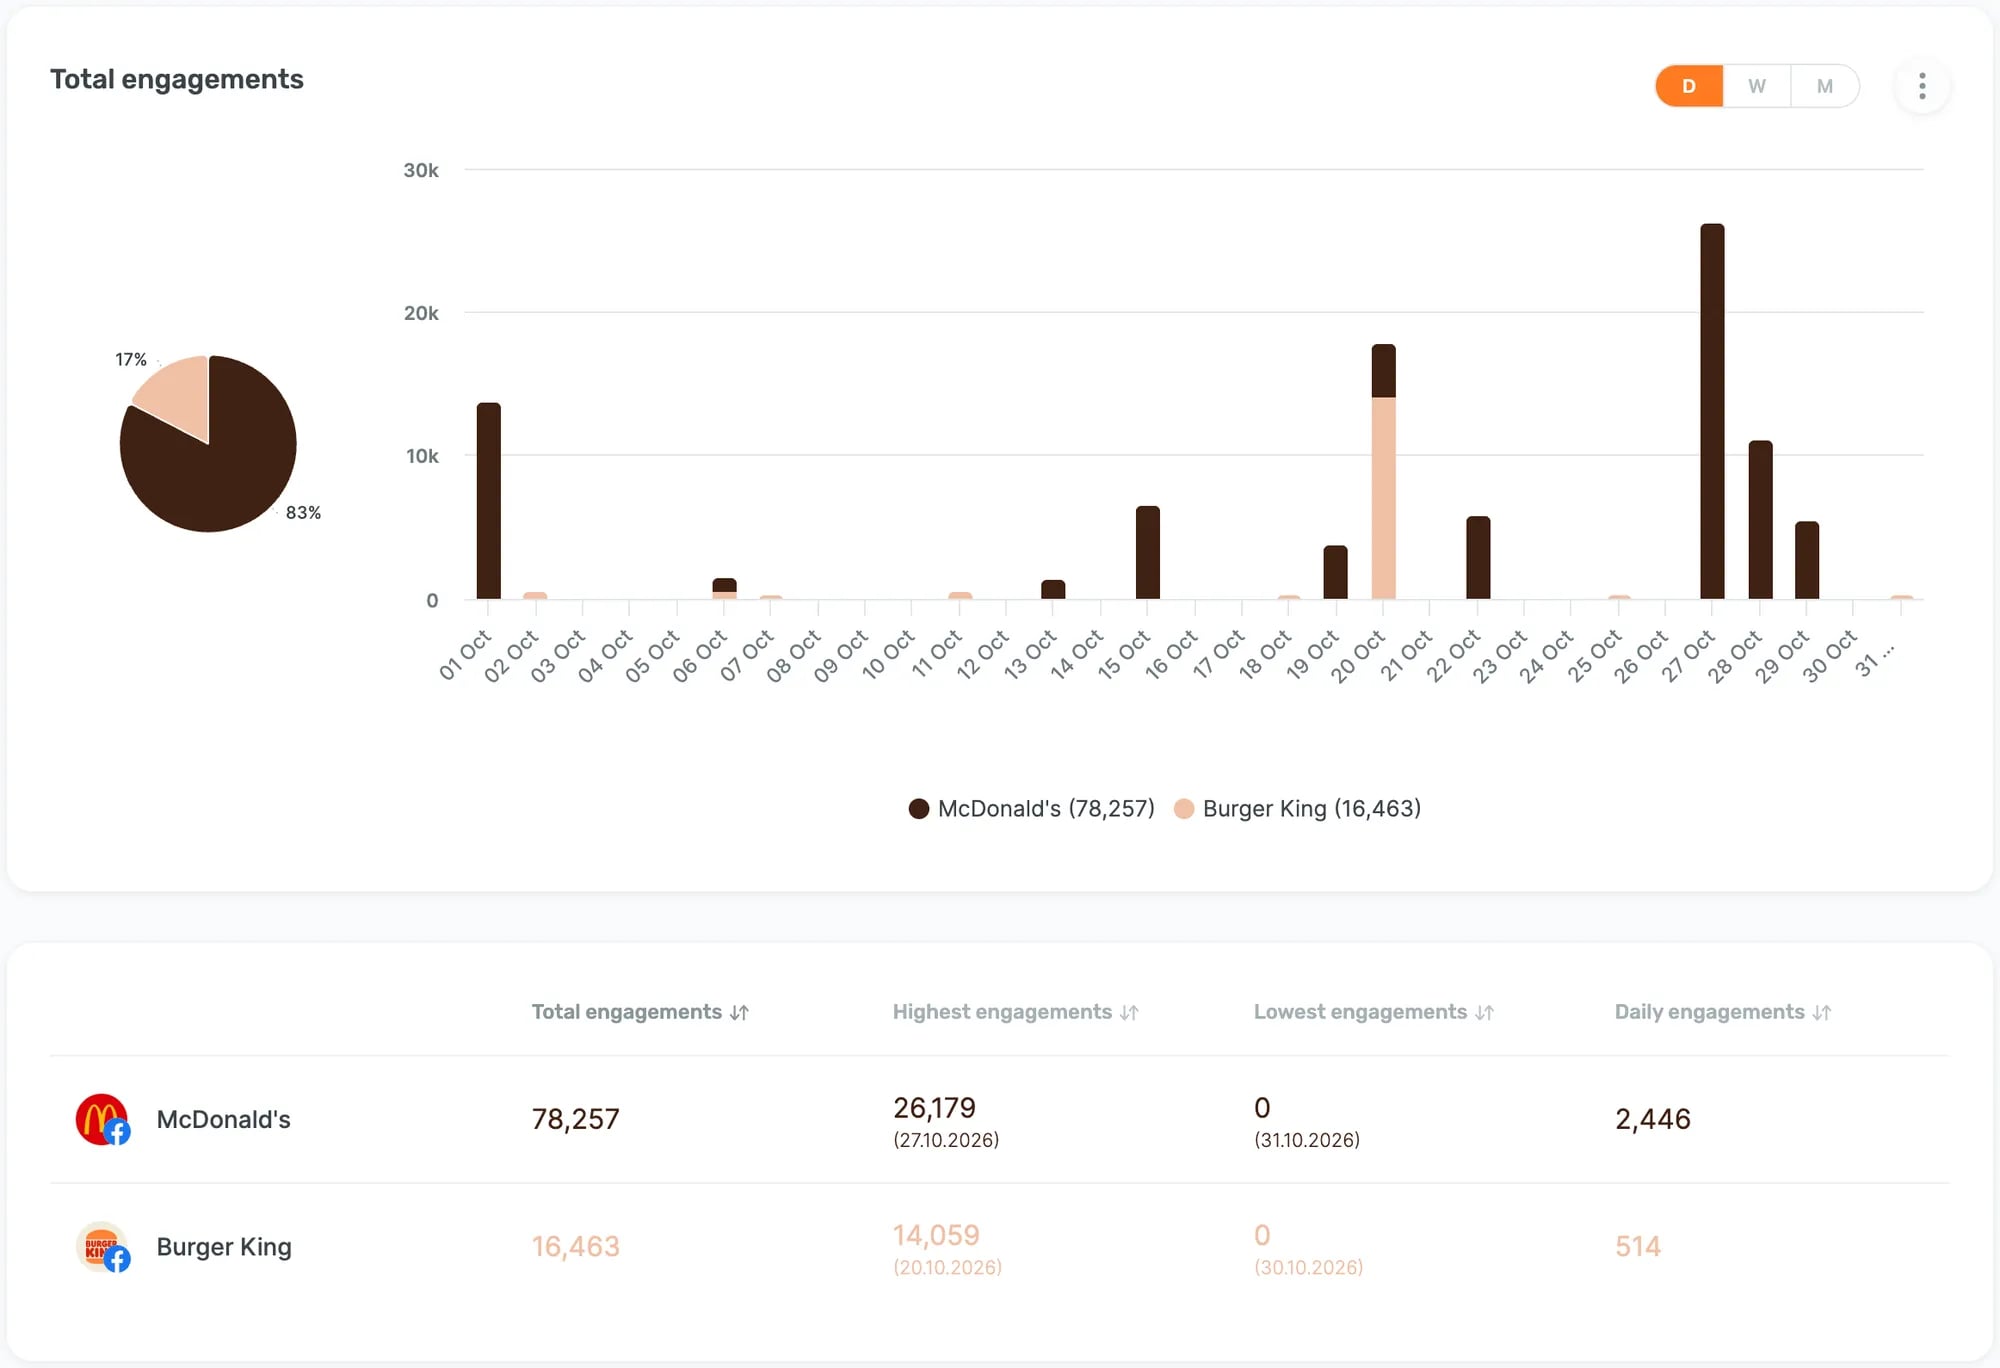
The third part of the Facebook Competitors Report showcases how much engagement your competitors receive for their Facebook posts. Other than the engagement totals by day, you can also dive deeper and see Interaction Types, which shows what kind of engagement your competitors receive the most: reactions, shares, or comments.
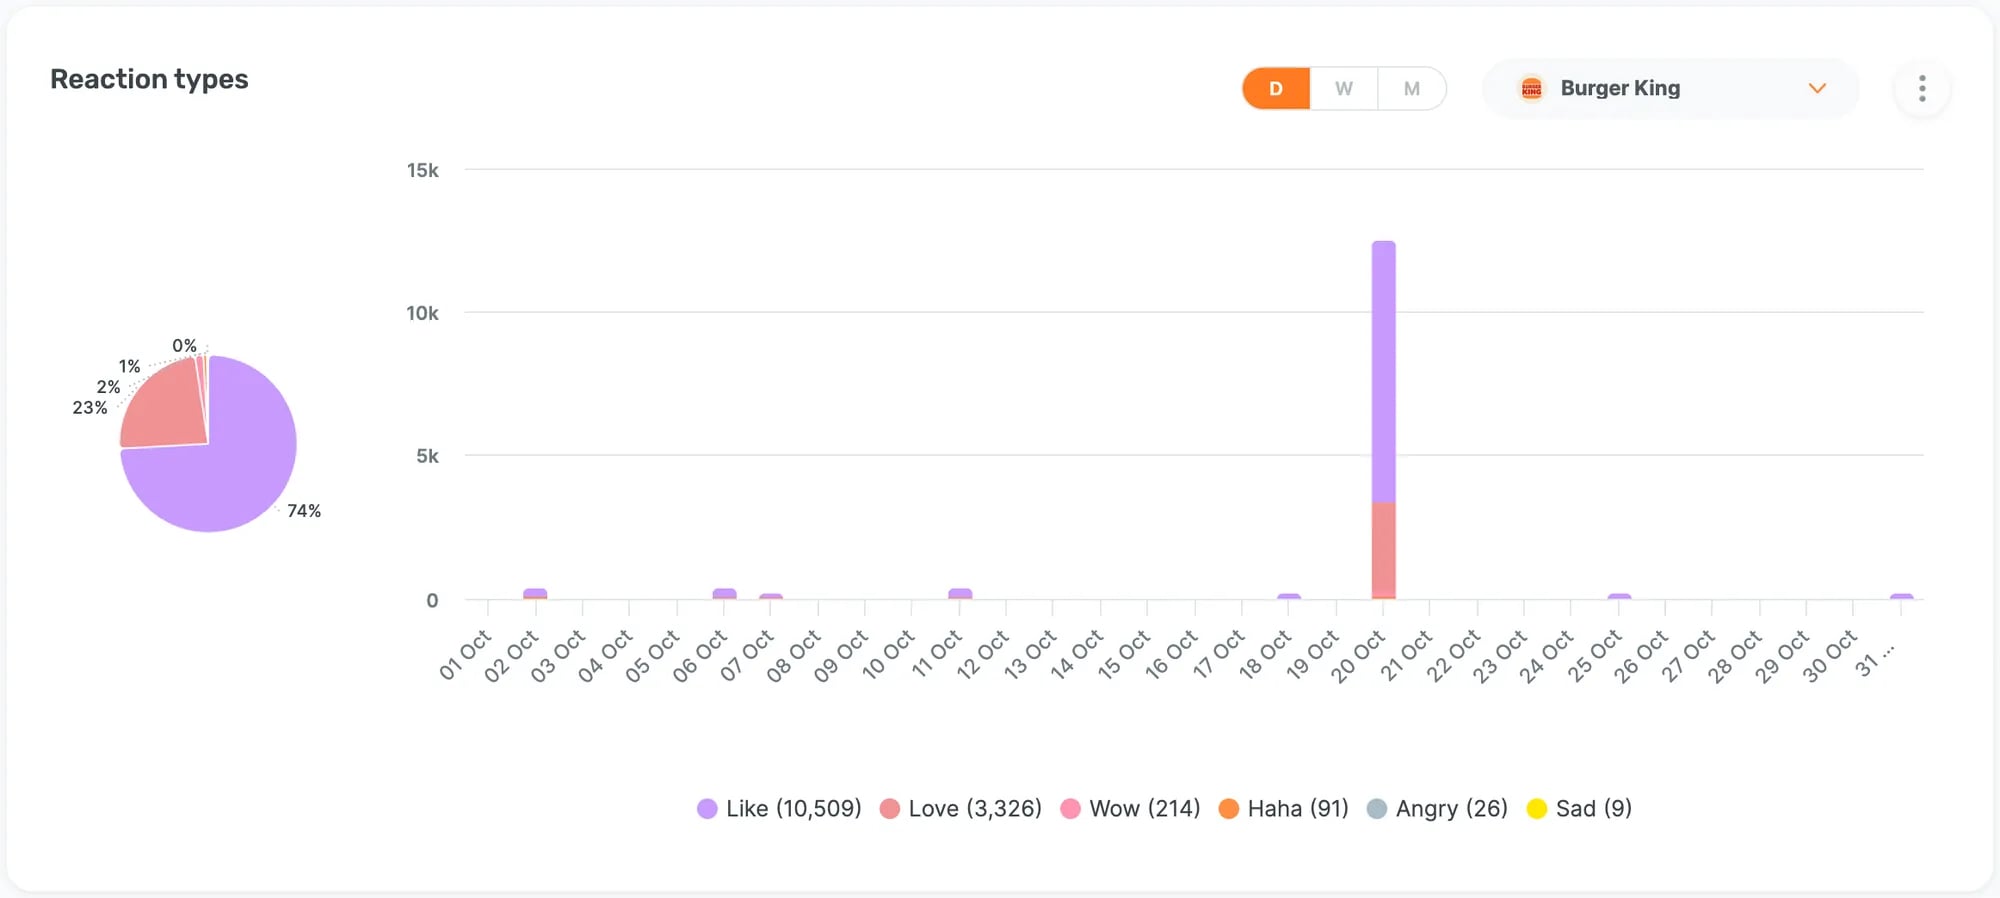
In Reactions, you can see the total number of reactions that your competitor got at your selected time, and Reaction Types shows you the types of responses that a specific competitor is receiving the most. Comments and Shares show the number of the respective engagements your competitor received either weekly or monthly in the selected period.
Content strategy
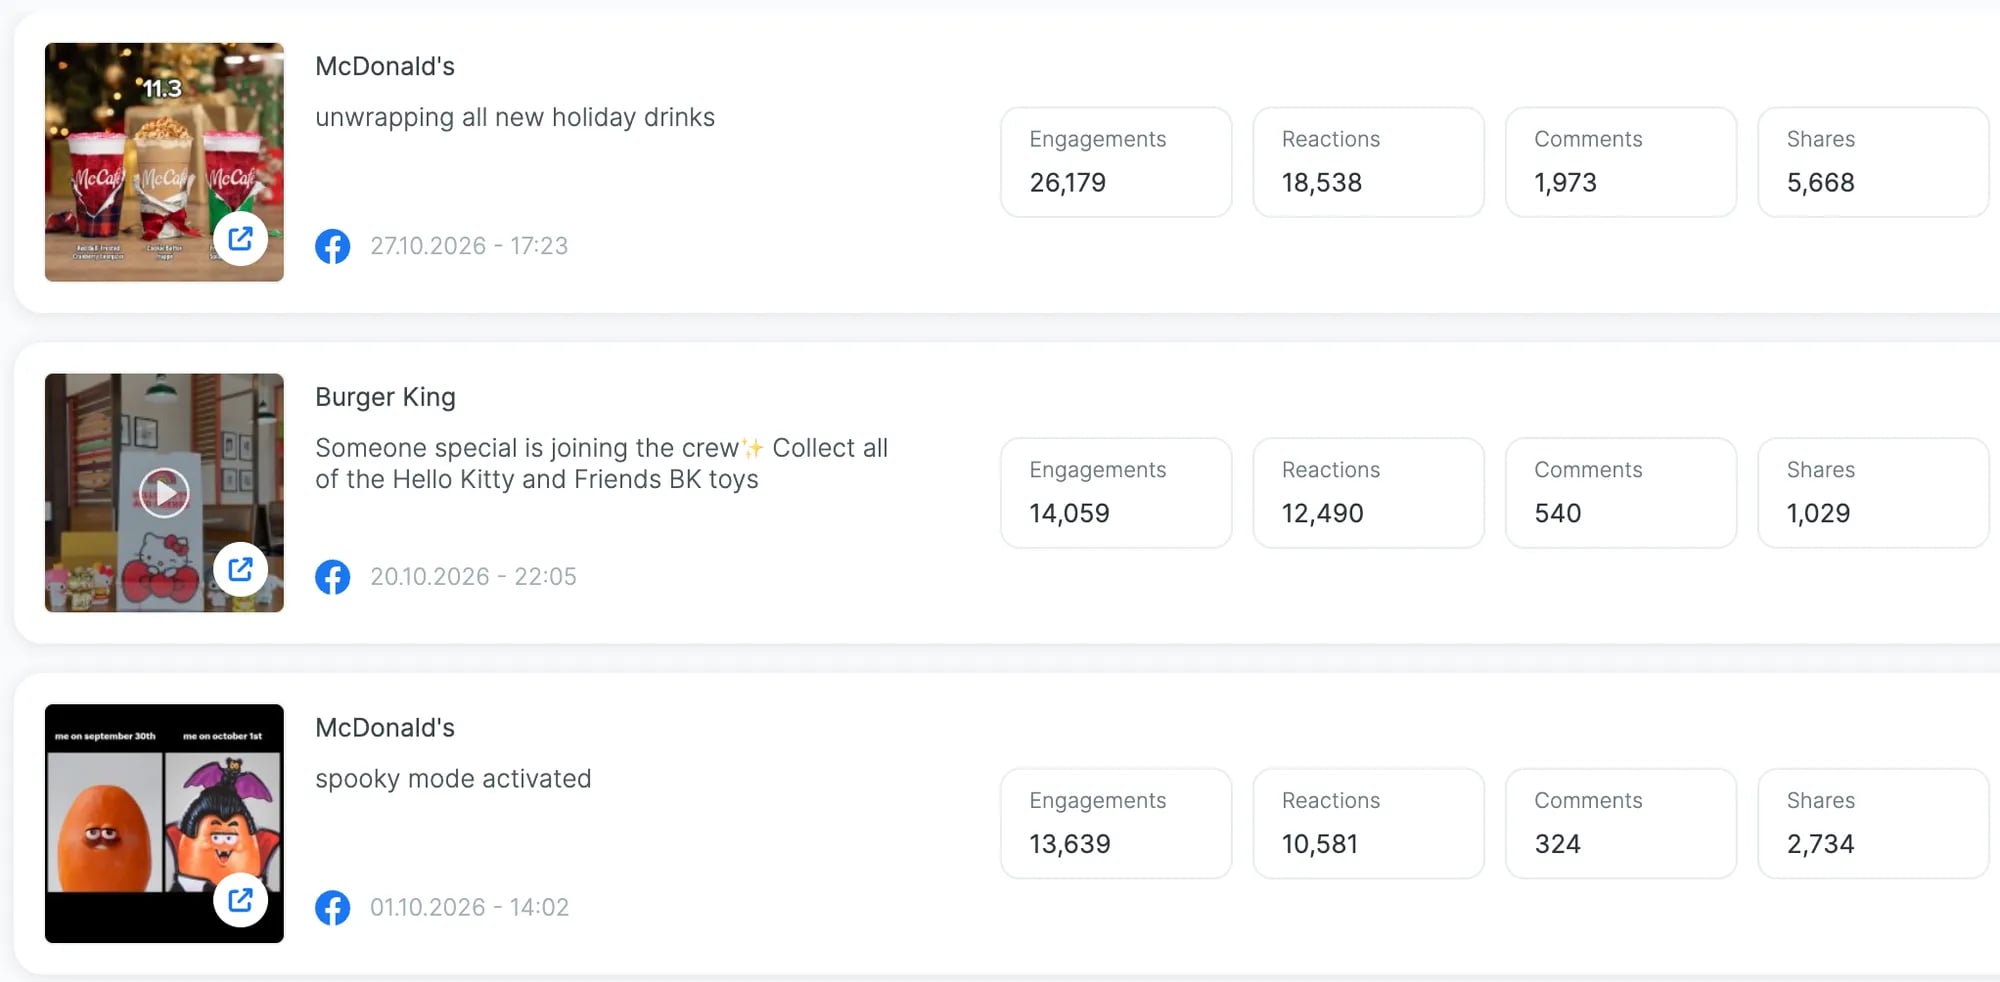
Sociality.io gathers your competitors’ content in one place so that you can use it depending on your needs.
With the help of your competitors’ content strategies, you can go behind the obvious metrics that you collected at the start of the guide to more sophisticated ones, as follows.
- What content generated the highest/lowest number of reactions?
- What content generated the highest/lowest number of comments?
- What content generated the highest/lowest number of shares?
- What content generated the highest/lowest engagement rate?
- What content generated the highest/lowest total interactions?
How to turn it into a Facebook competitor report
A competitor report should answer one question for your manager or client: how does our Page compare this month, and what will we test next? Keep it to one page:
- Scope: the Pages, why each is on the list, and the dates.
- Scorecard: followers and follower change, posts per week by format, and engagement rate per post (average and median), for every Page including yours.
- Top posts: each competitor’s best two or three posts, with links and dates, and what made them work.
- Ads: what each competitor was running in the Ad Library when you checked, with the offers and creative themes.
- What changed: spikes, new formats, campaigns and holiday posts.
- Tests for next month: two or three, each with an owner, a metric and a date to check it.
We recommend pulling the numbers on the same day each month and keeping last month’s report next to this one, because a follower trend or a single hit only means something in context. When the report goes to leadership, here’s how to explain social media reports to C-levels.
To save you the setup, we made a free Facebook competitor report template. It has a Page list, a post log, a monthly log with the formulas filled in, a scorecard with a median chart, and tabs for ads and tests. The Pages in it are made-up pizza places, so type over them with your own. (No, we won’t ask for your email address.)
To wrap it all up
Knowing your competitors’ following helps you put your own Page’s growth in context on Facebook. Use your competitors’ data to set SMART goals for your social media following. However, make sure you will compare yourself with competitors that are close to your current level. If you’re a sneaker brand that is just starting, comparing yourself to the industry giants like Nike and Adidas won’t be realistic in the short term.
Also, take the time to read who comments on their posts and which topics get them talking. Together with your own Insights, this can help you in your Buyer Persona development in case you haven’t done so already or are looking to improve it.
The more you know about your competitors, the more prepared you are for the market. So, make sure you always monitor your competitors, especially on social media, for better-targeted campaigns. Check out the rest of our series on social media competitor analysis:
FAQs about Facebook competitor analysis
Is there a free Facebook competitor analysis tool?
Meta’s own tools are the free option: Business Suite Insights compares your Page with businesses in your category and keeps a Businesses to watch list, and Meta AI can benchmark you against similar brands, free to start. For a monthly report across several Pages, Sociality.io compares up to 15 Facebook competitors with a 14-day free trial, and Sociality MCP lets ChatGPT, Claude or Gemini answer questions about them.
Can I see a competitor’s Facebook reach?
No. Reach, link clicks, Views on photo and text posts and follower demographics appear only in the Page owner’s Insights. When Facebook replaced impressions and Plays with Views in November 2024, reach stayed private. For competitors, compare what is public instead: followers, posts, reactions, comments, shares and Reels views, all for the same dates.
How do I compare engagement with competitors on Facebook?
Use one formula for every Page: reactions plus comments, divided by followers, times 100, per post, for the same calendar month and posts at least two days old. Report the median as well as the average, because one viral or boosted post can lift the average. Keep shares in their own column and compare Reels with Reels by views.
How do I see the Facebook ads my competitors run?
Open the Meta Ad Library, choose a country and All ads, then search the competitor’s name and pick its Page from the Advertisers list. You’ll see its active ads with start dates, platforms and versions. Inactive ads stay searchable only for political and issue ads, ads shown in the EU, and UK ads that ran after 1 July 2025.
Can I see how much a competitor spends on Facebook ads?
Not for ordinary ads. Meta shows spend ranges, and spending totals in the Ad Library Report, only for ads about social issues, elections or politics. For a competitor’s commercial campaigns, you can see the creative, the offer, the platforms and how long each ad has run, but not the budget or the results.
What is Facebook competitor analysis?
Facebook competitor analysis is comparing your Facebook Page with rival Pages on followers, posting, formats and engagement, then studying their top posts and ads to explain the differences. Done monthly with the same Pages, metrics and dates, it shows what is realistic in your market and which content your shared audience responds to.