


TikTok analytics guide 2025: How to check, track, and report (+PDF)
Summarize this article via
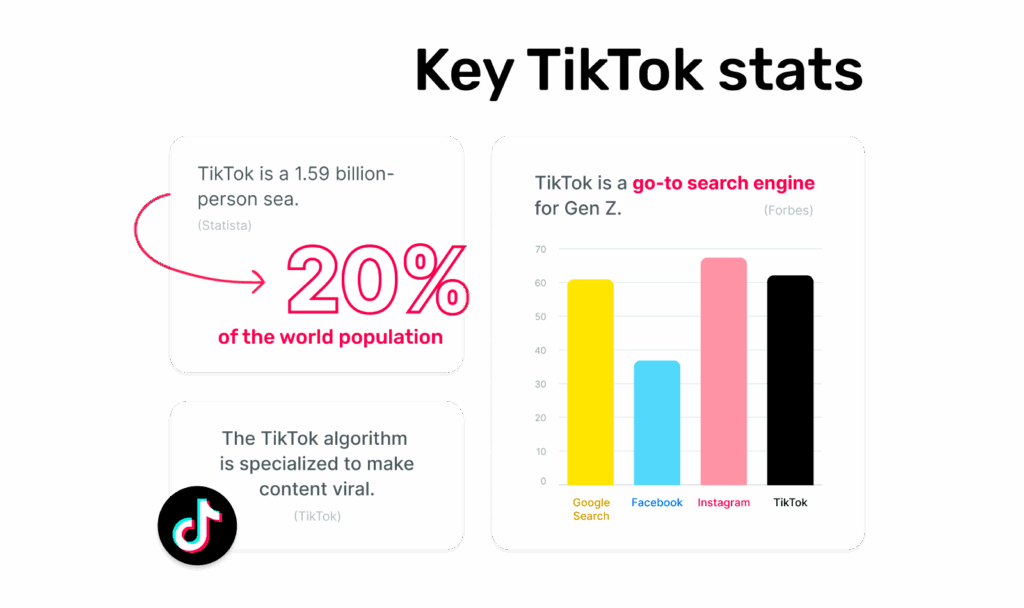
When you know TikTok analytics from inside to outside, you’ll be proficiently swimming in a 1.59 billion-person sea. (That’s roughly 20% of the world’s population. 😱)
So, you’d better catch those fish before they scroll away. 📱🐠
Let’s be real—today’s attention span is already short, and every swipe on TikTok makes it even shorter.
And, to get into your audience’s mind and attract their interest, you must know how to read the TikTok metrics.
But what exactly is TikTok Analytics, and why does it matter?
TikTok Analytics is the platform’s built-in reporting system (and in the case of advanced tools, an expanded version of it) that tracks your account performance, content reach, audience demographics, and engagement trends. From views and watch time to follower growth and conversion rates, it shows you exactly what’s working — and where you need to pivot.
By knowing how to understand and analyze TikTok data, you’ll not only get the audience you need, but you’ll also impress your clients or boss with data-driven strategies, smarter content decisions, and meticulous reporting. When you master TikTok Analytics, you’ll turn raw numbers into growth opportunities.
- TL;DR for busy marketers
- What is TikTok analytics & why should you care?
- How to see TikTok analytics (Step-by-step for 2025)
- Why use a social media management tool?
- TikTok analytics dashboard: What do they mean in 2025?
- TikTok analytics for business accounts
- Track your TikTok metrics fast and effectively – Use Sociality.io
- How to use TikTok analytics to improve performance
- Creating a TikTok analytics report that impresses 🤩
- Wrap-up in 10 seconds ⏳
I’ve created a real deep dive into analytics for TikTok, but if you are in a rush, I’ve got something suitable for you:
TL;DR for busy marketers
First things first.
It is way more than a social media app, and every marketer needs to know how to kill it on TikTok now:
- TikTok is a go‑to search engine for Gen Z.
- TikTok’s global ad revenue is projected to hit $32.4 billion in 2025.
- Users spend 35 hours per month swiping, streaming, and shopping.
- TikTok usage is 58 minutes a day in 12+ sessions.
We’re witnessing a cultural shift: for marketers, TikTok is already outperforming many traditional channels.
Now, here’s the kicker by TikTok: “… there’s no one For You feed – while different people may come upon the same standout video, each person’s feed is unique and tailored to that specific individual.”
So, “For You” algorithm of TikTok is never pushing random content. It’s a carefully crafted engine that gives every video a fair shot at going viral.
The advantage is real, but only if you’re measuring what matters.
🎉Ta da, I have the most important TikTok analytics in a nutshell for ya:
- Performance at a glance – Overview tab shows trends in views, profile visits, followers, and engagement over set time ranges (7, 28, 60 days, or custom).
- Post-level deep dive – Content tab reveals views, average watch time, retention curves, completion rate, traffic sources, and viewer territories for each video.
- Audience insights – The Followers tab covers growth trends, top territories, basic demographics, and peak activity hours to time posts for maximum reach. In other words, it’s your TikTok audience analytics.
- LIVE performance – LIVE analytics track session length, viewers, likes, Diamonds, and follower gains for real-time engagement analysis.
- Business-only extras – Business accounts unlock link taps, website clicks, conversions, audience overlap, and TikTok Pixel.
What is TikTok analytics & why should you care?
Think of TikTok Analytics as your backstage pass.
It’s where you see what’s really clicking—who’s watching, how long they stick around, and what makes them engage. No more guessing. Just clarity.
As Kyra Evans, a Content Marketing Manager at AgencyAnalytics, puts it:
“TikTok analytics help you monitor video views, engagement rate, follower growth, audience demographics… and elevate your marketing strategy from guesswork to measurable results.”
So, what exactly can you track in 2025? Let’s break it down.
15+ key TikTok metrics you can’t afford to ignore 💎
Straight from TikTok, here’s your breakdown of the metrics that actually matter in 2025 and how to use them.
- Video views
How many times your video has been watched. It’s your baseline reach metric – the one you’ll check first. - Likes, comments, shares
Core engagement actions. They live in your post analytics and roll up in Overview. Shares often expand distribution because they introduce your video to new viewers. - Profile views
How many times people opened your profile in the selected date range. Useful for judging curiosity and “next-step” intent after a video. - Followers
TikTok followers analytics is your growth trend over time. View this in Overview and get a deeper breakdown in the Followers tab. - Total play time (watch time)
The sum of all the time viewers spent watching a video (replays included). You’ll find it in Content analytics. - Average watch time
The average amount of time a viewer spent on your video. Great for reading hook strength and pacing. (Available in Content analytics.) - Completion rate / video finish rate
How often viewers reached the end of a video. A strong proxy for retention quality. (Surfaced in TikTok’s analytics/creator tooling.) - Traffic sources
Where people found your video—For You, Following, search, sounds, and more. Knowing this helps you double down on discovery tactics that work. - Audience territories
The countries or regions where your viewers are watching from. Handy for market targeting and language choices. - Follower demographics
A breakdown of your TikTok follower analytics (think gender, location, and sometimes age range) inside the Followers tab. - Follower activity (most active times)
When your followers are most active by hour/day. Post during these windows for maximum visibility. - LIVE analytics (for creators who go LIVE)
If you go live, you’ll see metrics like duration, total and peak viewers, likes, Diamonds, and new followers—great for measuring real-time impact. - Link actions (Business tools)
If you’ve enabled business features, you can see profile actions like bio link taps and other contact actions—useful for tracking “down-funnel” interest. - Post ranking / trending
TikTok highlights high-velocity content inside analytics (e.g., top/trending posts) so you can spot winners quickly and replicate patterns. - Search & discovery helpers (outside Analytics, still official)
Use TikTok Creative Center to research trending sounds, TikTok hashtags, and creatives before you publish. Pair that with your own Traffic sources to validate what actually brings viewers to your videos.
How to see TikTok analytics (Step-by-step for 2025)
Analytics are natively available on both Personal (Creator) and Business accounts, but you need at least one public post before TikTok shows any data.
Let’s look at how to access TikTok analytics natively both on desktop and mobile, step by step:
Business accounts—mobile (in-app):
- Open the menu (≡)
- Business Suite → Analytics for an account-level view (overview, followers, performance).
Business accounts—desktop (web):
- Go to TikTok Business Center
- Click on Business Suite (Web)
- Export analytics from the Analytics tab.
Personal (Creator) accounts—mobile (in-app):
- Open your profile
- Tap the menu (≡)
- Creator tools → TikTok Studio → Analytics.
You’ll see tabs like Overview, Content, Viewers, and Followers.

Personal (Creator) accounts—desktop (web):
- Sign in on TikTok.com
- Open TikTok Studio to access the same analytics dashboard in a browser.
TikTok Studio is TikTok’s official creation & analytics workspace, available as a mobile app and on the web.
Some quick notes so you don’t get stuck 😬
- Where’s the “analytics dashboard”? On creator accounts it lives in TikTok Studio; on business accounts it’s in Business Suite (mobile and web).
- Tabs you’ll see: creators get Overview / Content / Viewers / Followers in Studio; businesses get Overview / Followers and more in Business Suite (Web).
- No data yet? Post publicly at least once; TikTok won’t populate analytics until it has activity to measure.
BONUS PDF 🙅♀️: Don’t forget to get your TikTok analytics checklist. ✅
Once you’ve mastered TikTok’s native analytics, you might notice its limitations — especially if you manage multiple platforms:
Why use a social media management tool?
TikTok’s built-in analytics is a great starting point, but it has limits — especially if you’re managing multiple social platforms or running campaigns that span months (or even years). That’s where third-party social media analytics tools come in.
Instead of only seeing short-term, platform-specific insights, these TikTok analytics tools like Sociality.io, give you a bigger picture of your performance and help you make smarter decisions faster.
Here’s why upgrading from native analytics makes a difference:
- Unlimited historical data → Year-over-year strategy
Compare seasonal campaigns over multiple years to identify which formats work best. - Cross-platform comparison → Smarter content allocation
If TikTok posts are outperforming Instagram analytics by 40% engagement, you can shift ad spend and creative resources accordingly. - Advanced metrics → Content optimization
Use watch-time and retention curves to spot where viewers drop off, then adjust pacing and hooks. - Centralized workflows → Time savings
Respond to comments, schedule posts, and export reports without switching tools — freeing up hours each week for creative work.
TikTok analytics dashboard: What do they mean in 2025?
You’ll access analytics in TikTok Studio (via Creator Tools or Business Suite, depending on your account type).
The exact labels can vary by region, but you’ll typically see four areas:
- Overview
- Content/Video
- Followers/Audience
- LIVE
TikTok’s Help Center confirms where to find analytics and what they’re for; LIVE metrics are documented in detail by TikTok as well.
Let’s explore each one.
Overview
This section gives you a quick health check. 🩺
So, do you want a quick check-in to see how your brand’s doing? This is where you look.
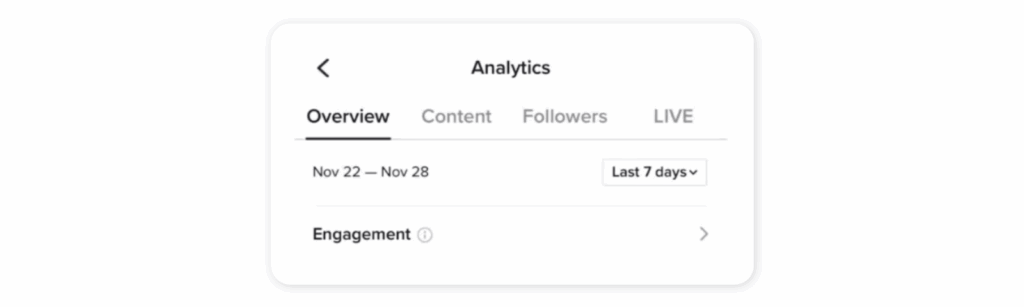
You can review totals and trends for things like video views, profile views, followers, and engagement (likes, comments, shares) over a selectable time range.
All data in the Overview section is broken down by date. You can filter the analytics results for the last 7, 28, and 60 days. Or set up a custom range of up to 60 days.
Content/Video
This is your post-level deep dive.
For each video, you’ll see views, average watch time, a retention curve, a completion signal (how often people finish), and traffic sources (For You, Following, profile, search, sounds).
You can also check viewer territories to see where attention comes from. So, use this tab to compare hooks, pacing, edits, and formats side-by-side.
Labels and filters can vary by region and by account type (Creator vs. Business). If you don’t see a metric where you expect it, open TikTok Studio → Analytics (via Creator Tools) or Business Suite → Analytics and set your date range first so comparisons stay apples-to-apples.
Followers/Audience
This is all about who you reach and when they’re online. So, you’ll get follower growth, top territories, basic demographics, and active times by hour/day.
After checking here, you can time TikTok posts smarter and spot new markets to lean into.
📌Some fields unlock after you hit activity thresholds. Keep posting, match the same date range across tabs, and check back in TikTok Studio → Analytics → Audience (or Business Suite → Analytics).
LIVE
When you go live on TikTok, you’ll have information about the duration, total and peak viewers, likes, Diamonds, and new followers on TikTok. I suggest analyzing these to find the best topics that align with your target audience.
And keep in mind that LIVE metrics may only show recent windows, like 7 or 28 days, depending on the region.
👉Check TikTok Studio → LIVE or Business Suite → Analytics and select LIVE.
TikTok analytics for business accounts
Running a Business account on TikTok? You’ve got more data at your fingertips than you might think—and it goes way beyond likes and views. These extra insights can help you tie your TikTok presence directly to real business results. Let’s unpack them.
Why is business analytics different?
If you’re on a Business account, your analytics tab unlocks more than just reach and engagement. You can see profile link taps, website clicks, conversions, and even audience overlap with your ads—intel you won’t get on a Creator account.
But why should you care?
Because this is the bridge between TikTok activity and the actions that actually grow your business.
Key paid TikTok ad metrics you must track 💸
Some of the paid TikTok ad performance metrics are your must-track buddies for high ROI when it comes to being successful in TikTok ads analytics:
- Click-Through Rate (CTR) is the percentage of people who click your ad after seeing it. Think of it as the “hook test.” TikTok Ads Manager shows most in-feed ads land between 0.8–1%, while 1–3% is strong. + TopView and Brand Takeover formats can shoot past 7–16%.
- Conversion Rate (CVR) is the % of clicks that actually turn into what you wanted—purchases, sign-ups, app downloads. Healthy range is 2–5% across e-com and lead gen.
- Cost Per Click (CPC) is how much you’re paying for each click. Average is between $0.50–$1.00, depending on audience targeting and competition.
- Cost Per Mille (CPM) is the cost to get your ad seen 1,000 times. Expect $3–$10, but in peak seasons or competitive niches, it can climb higher.
- Return on Ad Spend (ROAS) – The big one. How much revenue you earn for each $1 spent on ads. Benchmarks hover around 1.4–1.7x; top-performing e-com brands can push 2–3x, with exceptional campaigns hitting 4–5x.
Conversion tracking with TikTok Pixel
The TikTok Pixel is like your behind-the-scenes tracker, quietly connecting the dots between TikTok and your website. It follows actions like sign-ups, purchases, or form submissions—so you’ll know exactly which posts or TikTok ads are driving results.
@mike.rama TikTok pixel #tiktokmarketing #tiktokads #businesstiktok ♬ Sunny Day – Ted Fresco
Video 1: TikTok Pixel explained by a TikToker
Getting started is simple:
- Create a Pixel in TikTok Ads Manager.
- Install it on your site (manually or with a partner integration).
- Start linking ad and organic performance back to conversions.
Attribution windows & why they matter
Ever asked yourself, “How does TikTok decide which ad gets credit for a sale?” That’s your attribution window—and as a Business account, you can set it yourself.
Shorter windows (1–7 days) show quick-turn results.
Longer ones (14–28 days) capture those delayed “I’ll buy it later” conversions.
Choose the one that fits your sales cycle, and your TikTok analytics reports will be much more accurate.
Combining Organic + Paid Insights
Here’s where it all comes together. Pair Business Suite analytics (your organic performance) with Ads Manager (your paid campaigns) to see the full funnel.
That’s how you spot the TikToks that spark both engagement and sales—or figure out which ads shine brighter when supported by organic content.
When you look at them together, you stop guessing and start scaling what actually works.
Track your TikTok metrics fast and effectively – Use Sociality.io
Want the full picture without 12 tabs open?
Easy. Use Sociality.io to track TikTok analytics. (I believe it’ll be your fave TikTok analytics tracker.)
You can track TikTok in context—right alongside your other channels—so performance actually means something. In one dashboard, you’ll see the TikTok metrics that matter:
- TikTok post analytics/metrics
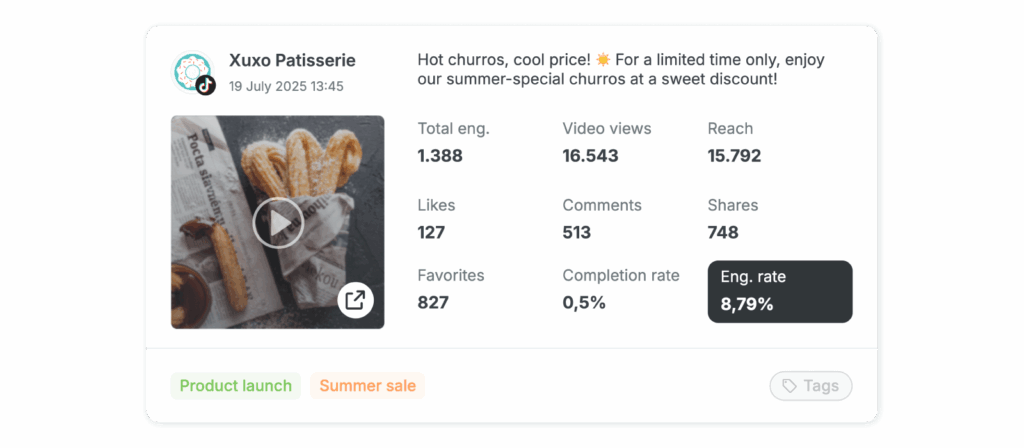
Every report ends with a full list of the videos your account published, complete with all insight metrics ranging from views per post, likes, and comments to avg. watch time, reach, shares, and many more.
Sociality.io’s table is fully sortable and filterable, so you can rank by views, engagement rate, completion rate, or any KPI in seconds.
- Viewer countries & impression sources
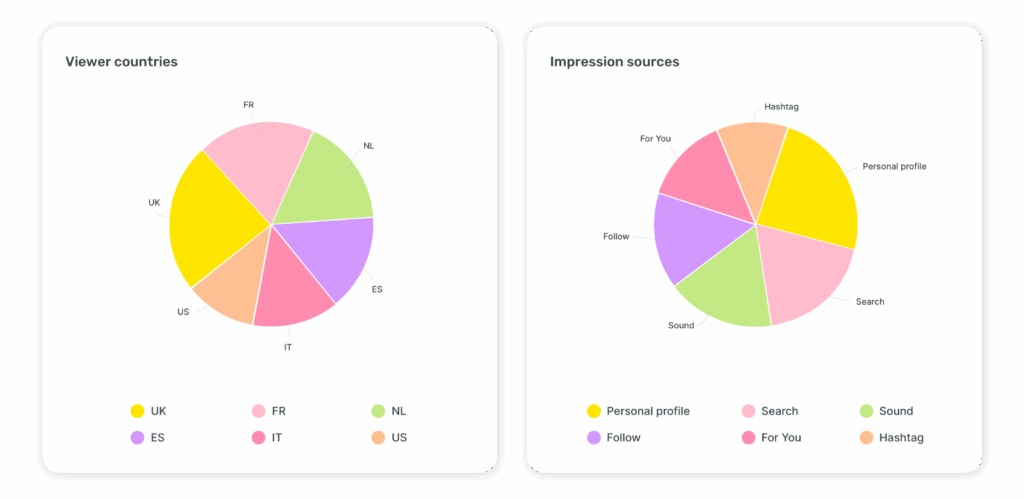
Sociality.io offers you clean and easy-to-read graphs that many tools skip. You can see where attention comes from and which surfaces drive it: For You, Following, Search, Sounds, or Profile.
- Best times to post on TikTok, unique to your account
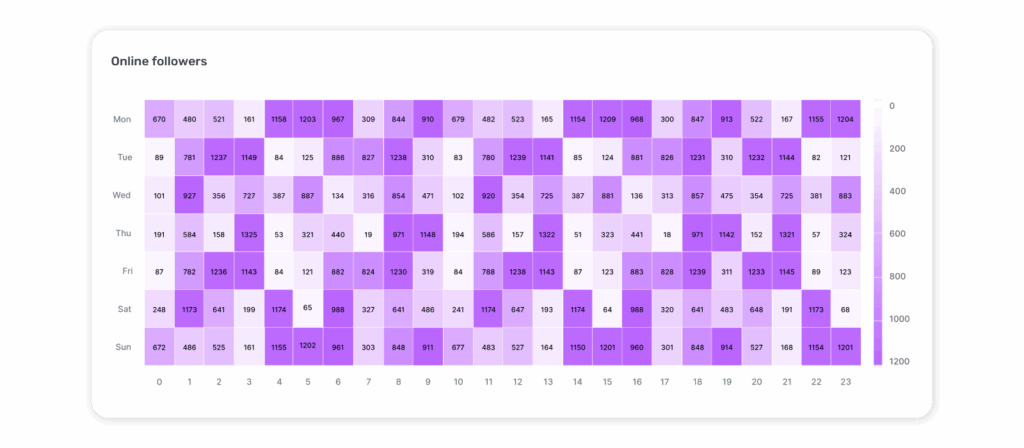
With this online followers heatmap, you can pinpoint your account’s prime time and increase your organic reach!
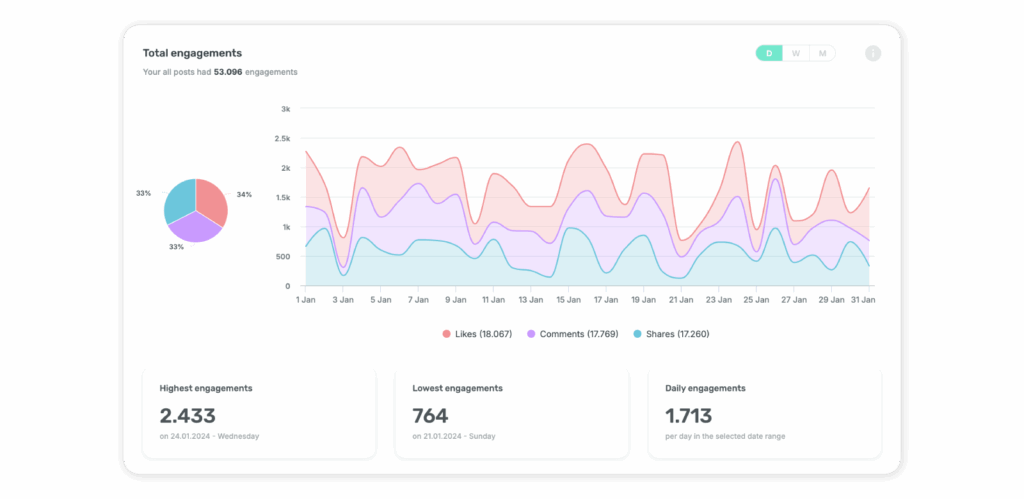
- Engagement & engagement rate
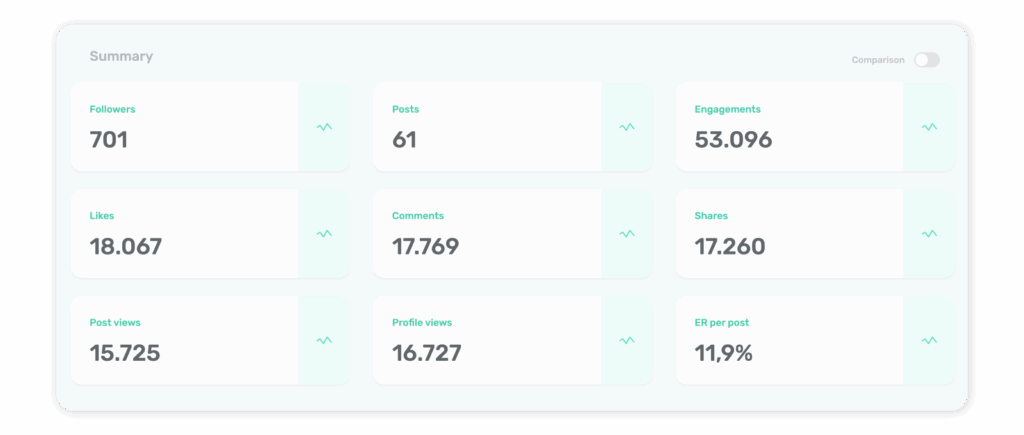
- Engagement breakdowns
- Post & views distribution
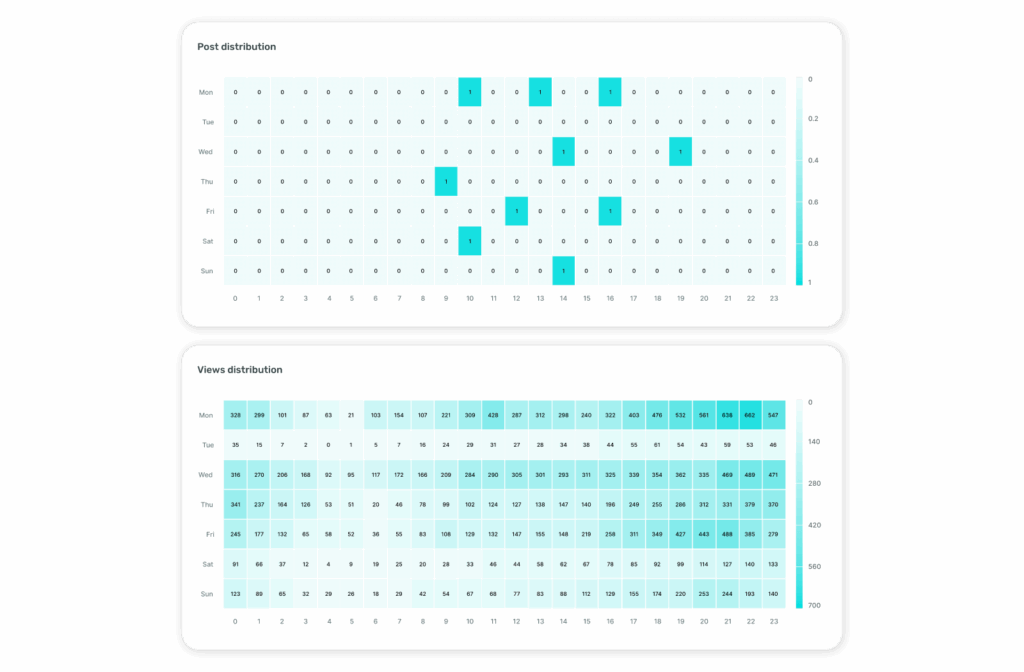
- TikTok hashtag analysis
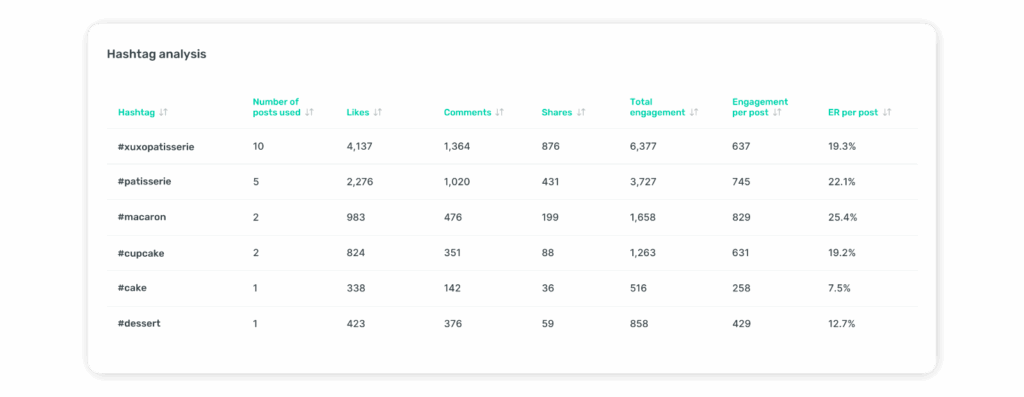
But tracking is just the start. With Sociality.io, you can also compare TikTok performance against your other social networks, so you see where you’re winning and where to double down.
Engagement? Covered.
You can respond to TikTok video comments in real time, prioritize what matters most, and never miss a chance to connect. 🩵
So, using Sociality.io to track TikTok stats translates to less copy-pasting, more decisions. One click, real insight.
And you won’t have to wait days to get it, either. Like Sena Arisoy, Head of Social Media at Engage Istanbul, said:
“Before using Sociality.io, I’d spend a whole day preparing a detailed report. Now with Sociality.io, it takes me 15 mins tops.”
Start your 14-day free trial—then spend minutes on reports, not days.
Comparison of Sociality.io vs TikTok Native Analytics
| Feature | Sociality.io analytics | TikTok native analytics | Why Sociality.io is better |
|---|---|---|---|
| Multi-platform integration | Combines TikTok data with Instagram, Facebook, LinkedIn in one dashboard | Only TikTok data available within TikTok app | Enables cross-platform performance comparison and unified reporting |
| Multiple account management | Manage and analyze multiple TikTok accounts from one place | Separate login and analysis per TikTok account | Saves time for agencies and social media managers handling many accounts |
| Customizable reports | Automated, brandable reports in XLSX, PPT, PDF formats | Basic exports and screenshots from TikTok app | Professional reports ready for client or team presentations |
| Comment management | Respond directly to TikTok video comments within the platform | Must respond in TikTok app | Streamlines community engagement and response workflow |
| Deeper hashtag & audience insights | Detailed hashtag performance and audience interaction analytics | Basic hashtag views and follower demographics | More granular data to optimize content strategy and targeting |
| Content scheduling & publishing | Schedule TikTok posts alongside other social networks | No native scheduling in TikTok app | Facilitates planning and consistency across platforms |
| Audience heatmap & best posting times | Visual heatmaps showing follower activity by time and day | Basic follower activity info only | Helps find the exact optimal posting times for maximum engagement |
| Efficiency & automation | Centralized, time-saving dashboard with automated insights | Manual data checking and export required | Reduces workload and increases marketing agility |
How to use TikTok analytics to improve performance
So, you’ve got the numbers—now what? 🤔
You can start by spotting your top-performing videos. Then ask: why did this one take off? Was it the hook, the sound, or the posting time? Keep those winners on repeat.
If engagement starts slipping, you might need to switch gears. Try new hooks, adjust pacing, or test a different format—and watch how your analytics react.
Let your audience data do the heavy lifting. Demographics, active hours, and top territories aren’t just “nice to know” stats—they’re a cheat sheet for making your content feel tailor-made.
And don’t sleep on watch time. If you see a drop halfway through, that’s your cue to tighten your edit or bring the hook in earlier.
Test, measure, tweak, repeat. That’s how you turn data into growth.
Creating a TikTok analytics report that impresses 🤩
If your analytics live and die inside TikTok Studio or Business Hub, you’re leaving impact on the table.
A polished report turns raw data into a clear story—and stories get your stakeholders to act.
Step 1️⃣: Choose your export method
TikTok Studio
Your go-to for Creator and Personal accounts. Export both post-level and account-level data, then layer in video retention curves and traffic sources for context. You’ll also get audience activity breakdowns and engagement trendlines—perfect for spotting patterns at a glance.
Business Hub
For Business accounts, open the Business Suite’s Analytics tab. You’ll get clean, exportable views of reach, engagement, followers, and conversions—ideal for sharing with marketing, creative, or leadership without a formatting headache.
Sociality.io
Here’s where it all comes together. Sociality.io pulls your TikTok analytics into the same dashboard as Instagram, Facebook, LinkedIn, and more—so you can see how TikTok stacks up in your whole social mix. No more endless copy-pasting into Excel—just one view, all your metrics, ready to share.
Step 2️⃣: Decide what goes in the report
A standout TikTok report balances KPIs, trends, and action items—not just screenshots. At minimum, include:
- KPIs – Video views, engagement rate, completion rate, follower growth
- Trends over time – Weekly or monthly performance shifts (not just the last post)
- Top posts – The clips that actually moved the needle
- Audience insights – Demographics, top territories, active hours
- Action items – What you’ll test, tweak, or double down on next
Step 3️⃣: Format for impact
- Lead with wins – Open with what worked before covering what didn’t
- Visuals > tables – Charts, heatmaps, and thumbnails keep eyes on your report
- Call out patterns – “Videos under 20s keep 70%+ retention” beats “Avg watch time: 14s”
- End with next steps – Make sure everyone knows what’s happening before the next report
Bonus tips for 2025 TikTok analytics
When you share reports, tie each metric to a decision so it’s not just a vanity number:
⭐ “Retention dropped → Testing stronger hooks in the first 3 seconds.”
⭐ “Top territory shifted → Adding captions in Spanish.”
And to give your results context:
- Average engagement rate (2025): ~3.3%. Above this? You’re outperforming the platform. Below? Experiment with interactive captions, polls, or calls to action.
- Completion rate goal: 60–70% is solid; 80%+ means your retention game is strong. Under 50%? Tighten pacing and kill slow intros.
- Posting cadence: Many brands build momentum at 3–5 posts/week. But quality beats quantity—watch how frequency affects watch time and engagement before scaling.
So, that’s how you turn TikTok analytics from a monthly ritual into a growth engine.
Not just “here’s the data”—but “here’s what we’re doing next.”
Comparing analytics ⚔️ TikTok vs Instagram Reels vs YouTube Shorts
So, you want to know where TikTok marketing stands next to its short-form rivals?
Let’s break it down—metrics, behaviors, and where each one shines—so you can choose the right battlefield for your content.
Here’s my quick side-by-side look at TikTok, Instagram, and YouTube from the short-form lens:
| Feature | TikTok | Instagram Reels | YouTube Shorts |
| Metrics depth🧠 | Completion rate, total & avg watch time, retention curves, traffic sources, audience insights | Views, reach, engagement rate, watch time, saves, profile actions | Views, watch time, CTR to long-form videos, subscriber impact |
| Viewer behavior & algorithm👀 | Trend-driven, rewards early engagement & watch time | Integrates into overall IG ecosystem; feed & Reels cross-boost | Suggestion-based + subscriber blend; long-tail discovery |
| Engagement tracking👩💻 | Shares, comments, likes, favorites, Duets/Stitches | Shares, saves, comments, likes | Likes, comments, shares, “Not interested” feedback |
| Best context for brands💡 | Viral trends, creator collabs, high-frequency posting | Brand storytelling, consistent visuals, cross-format synergy | Education, entertainment, brand-to-long-form funnels |
FAQs about TikTok analytics (Quick answers for busy marketers)
Wrap-up in 10 seconds ⏳
I’ve created this TikTok analytics blog post to ensure that you have the ultimate cheat sheet for what to double-down on, what to ditch, and how to turn swipes into sales.
- Stop treating metrics like a report card → Use them to plan your next move. If your retention drops halfway, re-cut the opening and test a stronger hook.
- Combine organic + paid data → Compare your TikTok Ads Manager CTR/CVR with your organic engagement to see which creatives perform across both. Scale the overlap.
- Use benchmarks as an early warning system → Falling below industry CTR or completion rate? Run an A/B test with a new CTA or trending sound within the week.
- Turn audience insights into scheduling power → Post when your audience is most active, then track if engagement rates jump in the next 7 days.
You now have the numbers and the playbook to act on them.
If this helped, share it on LinkedIn and tag me—I’d love to hear your TikTok analytics wins, tests, and even your fails. Let’s swap notes. 👀🤝👀