
Competitive analysis with ChatGPT works when you give the model real numbers: two to five competitors, one platform, a fixed date range and their post data in the chat. Then you ask focused questions and check every figure against the source. Without that data, ChatGPT fills the gaps with numbers that sound right and often aren’t.
You wake up to a competitor’s campaign that’s suddenly everywhere. It’s trending on X, stitched on TikTok, shared on LinkedIn, and you want to know why it worked before your next planning meeting. With 5.81 billion social media user identities in October 2026, nobody can scroll that feed by hand, so it’s tempting to paste the brand name into ChatGPT and ask. I suggest, instead of copying what works for them, you try understanding why it works, and that takes data the model doesn’t have on its own.
Most of us already use AI for this kind of work. In Sociality.io’s 2026 AI in social media marketing survey, 89.7% of marketers said they use AI daily or several times a week. Results lag behind use, though: in McKinsey’s State of AI in 2026, 37% of respondents attribute at least some EBIT impact to AI, about the same share as a year earlier. In social media competitive analysis, the difference usually comes down to the data you give the model and how hard you check what it hands back.
TL;DR: Competitive analysis with ChatGPT in one view
- ChatGPT can’t sign in to a competitor’s account. Through Instagram’s API, a connected tool gets another business account’s follower count and each post’s likes and comments, not its reach or saves.
- OpenAI tells users to verify important information from reliable sources and lists fabricated quotes, studies and citations among ChatGPT’s known mistakes, so every competitor number needs a source row.
- ChatGPT reads connected data through custom MCP servers: read/fetch on Pro, full MCP on Business, Enterprise and Edu. Claude takes custom remote MCP connectors from the Free plan, which is limited to one.
- In October 2026, Starbucks earned more interactions per Instagram post than Dunkin, but Dunkin’s median engagement rate by followers was 1.50% against 0.37%, and 17 of Starbucks’ 19 posts were promoted.
What ChatGPT can and can’t see on social media
ChatGPT can search the web on every plan, from Free to Enterprise, read the spreadsheets, documents and screenshots you upload, and query apps or MCP servers you connect. That covers more than most people expect, and it still leaves out the numbers you most want.
What it can’t do is sign in as your competitor. Reach, impressions, saves and audience demographics stay private to each account, so you analyze Instagram competitors on their public numbers. Even a tool with official API access gets only the public layer: Instagram’s business discovery endpoint returns another business or creator account’s follower count, media count and each post’s like and comment counts (Meta for Developers), and nothing about who saw the post.
Collecting the rest yourself isn’t a way around it either. Meta said in 2021 that “using automation to get data from Facebook without our permission is a violation of our terms” (Meta), so you analyze Facebook competitors from what their Pages show in public. LinkedIn doesn’t allow third-party software that scrapes or automates activity on the site (LinkedIn Help), and TikTok’s Research API is closed to creators, advertisers and commercial users (TikTok for Developers).
Web search helps you find a campaign page or a post URL. It won’t give you a dated, post-level dataset, and when that data is missing, the model may still hand you a confident table. So start every analysis with a plainer question: what data am I giving it, and where did it come from?
How to do competitive analysis with ChatGPT, step by step
Six steps, and they work the same way in Claude. The first two decide whether everything after them is analysis or guesswork.
Step 1: Pick your competitors, one platform and a date range
Start with a core list of two to five rivals that serve the same audience, on one platform, for a fixed period such as a calendar month. Five strong profiles reveal more than fifty random ones. Include three kinds if you have them:
- Direct: same products or services.
- Indirect: brands creating content for the same audience mindset.
- Emerging: creators or startups shaping your category’s tone.
Sometimes the account reshaping what your audience expects is a creator nobody put on the competitor list. Write down each exact handle and profile URL, so the model can’t mix up two brands with similar names, and decide what you want to learn before you open the chat: content gaps, format mix, engagement or campaign ideas.
Step 2: Get real competitor data into the chat
This is the step most guides skip. ChatGPT can only compare what you put in front of it, and there are three ways to do that:
- Upload an export. A CSV or spreadsheet with each post’s date, URL, format, caption, likes and comments, plus the follower count on a fixed date. Claude reads CSV too, and XLSX once code execution is turned on (Anthropic).
- Add labeled screenshots when the creative matters, such as a Reel’s first frame or a carousel cover.
- Connect the data. A social media MCP server links the assistant to the tool that already tracks your competitors, so you ask and it fetches. Sociality MCP does this for the competitors you track in Sociality.io, with page stats and post-level engagement for Instagram, TikTok, LinkedIn, YouTube, X and Facebook, in ChatGPT, Claude or Gemini.
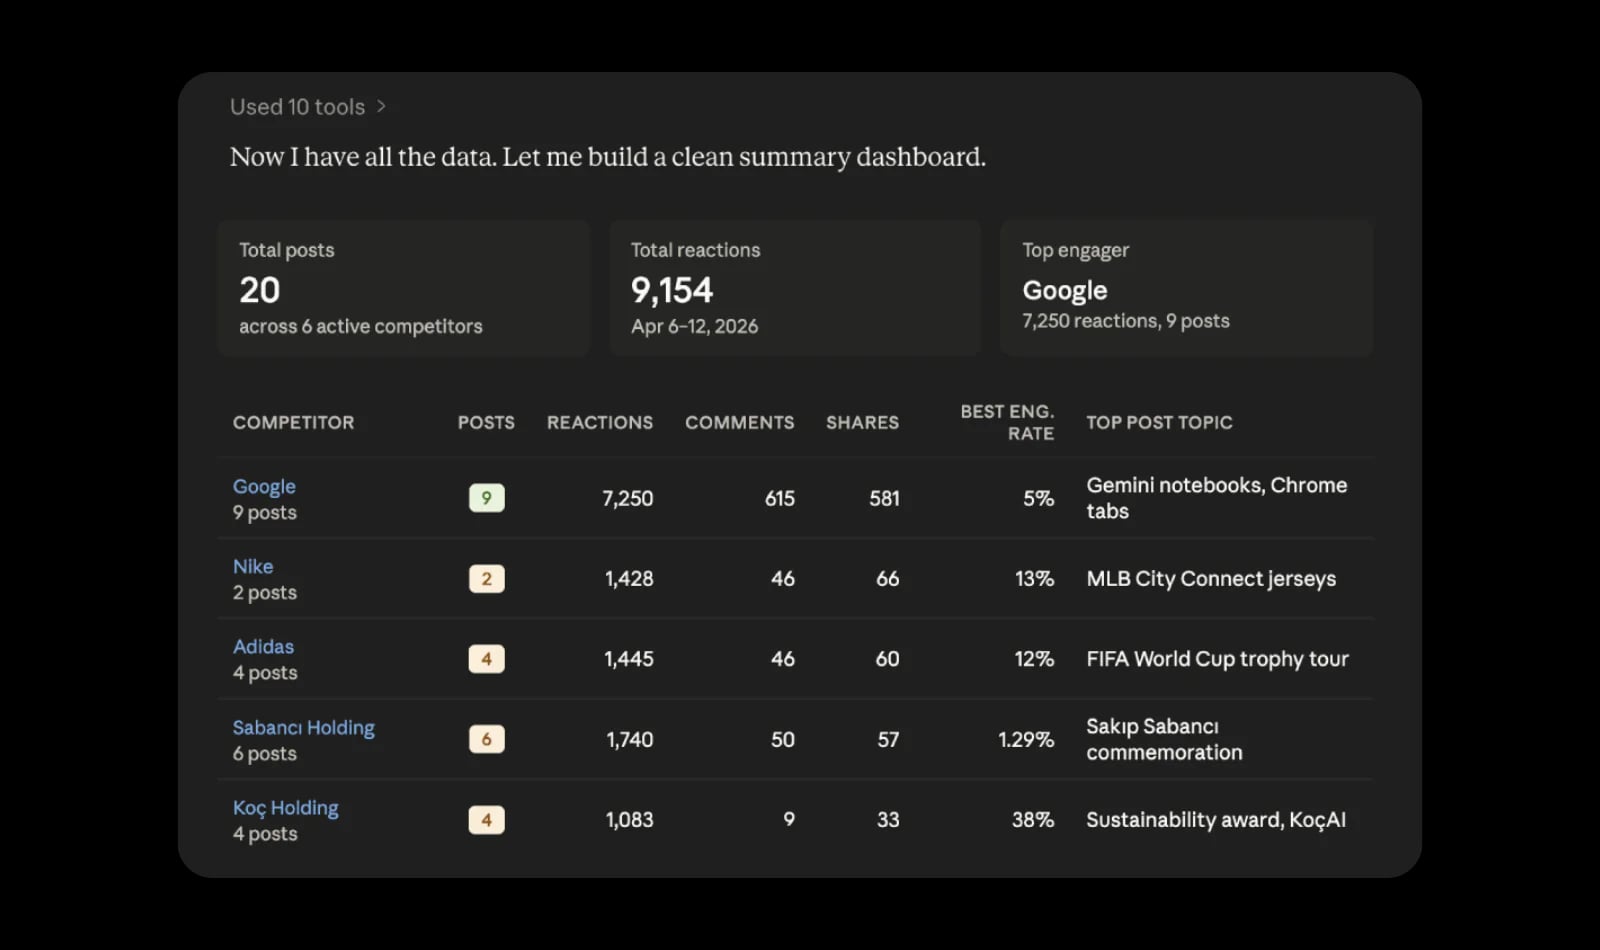
Whichever route you take, check the date on the data, and never ask the model to fill in a number your export doesn’t have. For setup in ChatGPT, Claude or Codex, see our guide to MCP for marketing. That’s also why the best ChatGPT apps for social media managers are the ones that connect to your data instead of waiting for a paste.
Step 3: Make the comparison fair
Use the same date range and the same metric definitions for every account. Likes and comments for one brand against likes, comments and shares for another is not a comparison. When accounts differ in size, divide by followers on a matching date, so a brand with 17 million followers doesn’t win by default; the formulas are in our guide to competitive benchmarking. Mark missing fields as missing, and never let a zero stand in for a blank.
Did engagement spike because of timing, tone, or trend? Sometimes the “why” hides in the caption rather than the numbers. To check whether one post is a real spike, the calculator scores the latest engagement against the account’s average and standard deviation:
💡 Engagement Anomaly Score Calculator
Ever wondered if that post’s spike in likes was a real breakthrough or just random luck? 🤔 Enter your numbers below to see whether the result falls inside your normal range or stands out as a true anomaly.
Formula: (Latest − Average) ÷ Standard Deviation = Anomaly Score
How to read it:
< 1 = Normal range · 1–2 = Moderate spike · > 2 = Significant anomaly, worth digging into!
Step 4: Ask one focused question at a time
A clear prompt could save you hours of cleanup later. Brief the model like you would brief a real analyst: the accounts, the platform, the dates, the metric and the output you want. You might think longer prompts give better results, but they rarely do. What matters is clarity, so the model guesses less. Ask for the post IDs behind every finding, and ask it to keep what it observed apart from why it thinks it happened. And if you’d like a table or a chart, just say so.
Step 5: Recheck the numbers
Recalculate one or two rates by hand from the source file and open the top posts the model picked. If the totals don’t match, the rest of the answer doesn’t count. The seven checks before a report goes out cover the rest.
Step 6: Write the report and repeat it monthly
Lead with three lines: what rose, what fell, what changed. Then the comparison table, three content tests for next month and the method, so the next report uses the same rules. This prompt turns verified findings into that report:
“Write a monthly social media competitor report for [month] comparing [our brand] with [competitors] on [platform], using only the verified tables above. Include a 150-word summary, a comparison table, three findings with the post IDs behind them, three content tests for next month with a metric each, and the method: formulas, dates and missing data. If a figure isn’t in the data, write ‘not in the data’.”
Run the same method next month so the trend means something; both assistants can run it on a schedule.
ChatGPT competitor analysis example: Starbucks vs Dunkin on Instagram
We track Starbucks and Dunkin as competitors in a Sociality.io workspace, so we pulled both brands’ October 2026 Instagram numbers through Sociality MCP on 9 and 10 November: every post published from 1 to 31 October and the daily follower counts. Interactions here are likes, comments and reposts. It’s one month of public data for two accounts, so read it as a demonstration of the method rather than a benchmark for coffee chains.
Ask “which brand did better on Instagram in October?” and the obvious ranking is raw interactions per post. On that measure Starbucks wins, with a median of 64,415 interactions per post against Dunkin’s 51,092. Ask a better question and the answer flips.
| Instagram, 1 to 31 October 2026 | Starbucks | Dunkin |
|---|---|---|
| Followers on 31 October | 17,579,397 | 3,411,272 |
| Follower growth in October | +17,030 (+0.10%) | +47,425 (+1.41%) |
| Posts (per week) | 19 (4.3) | 34 (7.7) |
| Format mix | 17 Reels, 2 carousels | 18 carousels, 10 photos, 6 Reels |
| Median interactions per post | 64,415 | 51,092 |
| Median engagement rate by followers | 0.37% | 1.50% |
| Promoted posts | 17 of 19 | 0 of 34 |
| Share of interactions from paid distribution | 35.9% | 0% |
| Median organic interactions per post | 42,398 | 50,116 |
| Median organic engagement rate by followers | 0.24% | 1.47% |
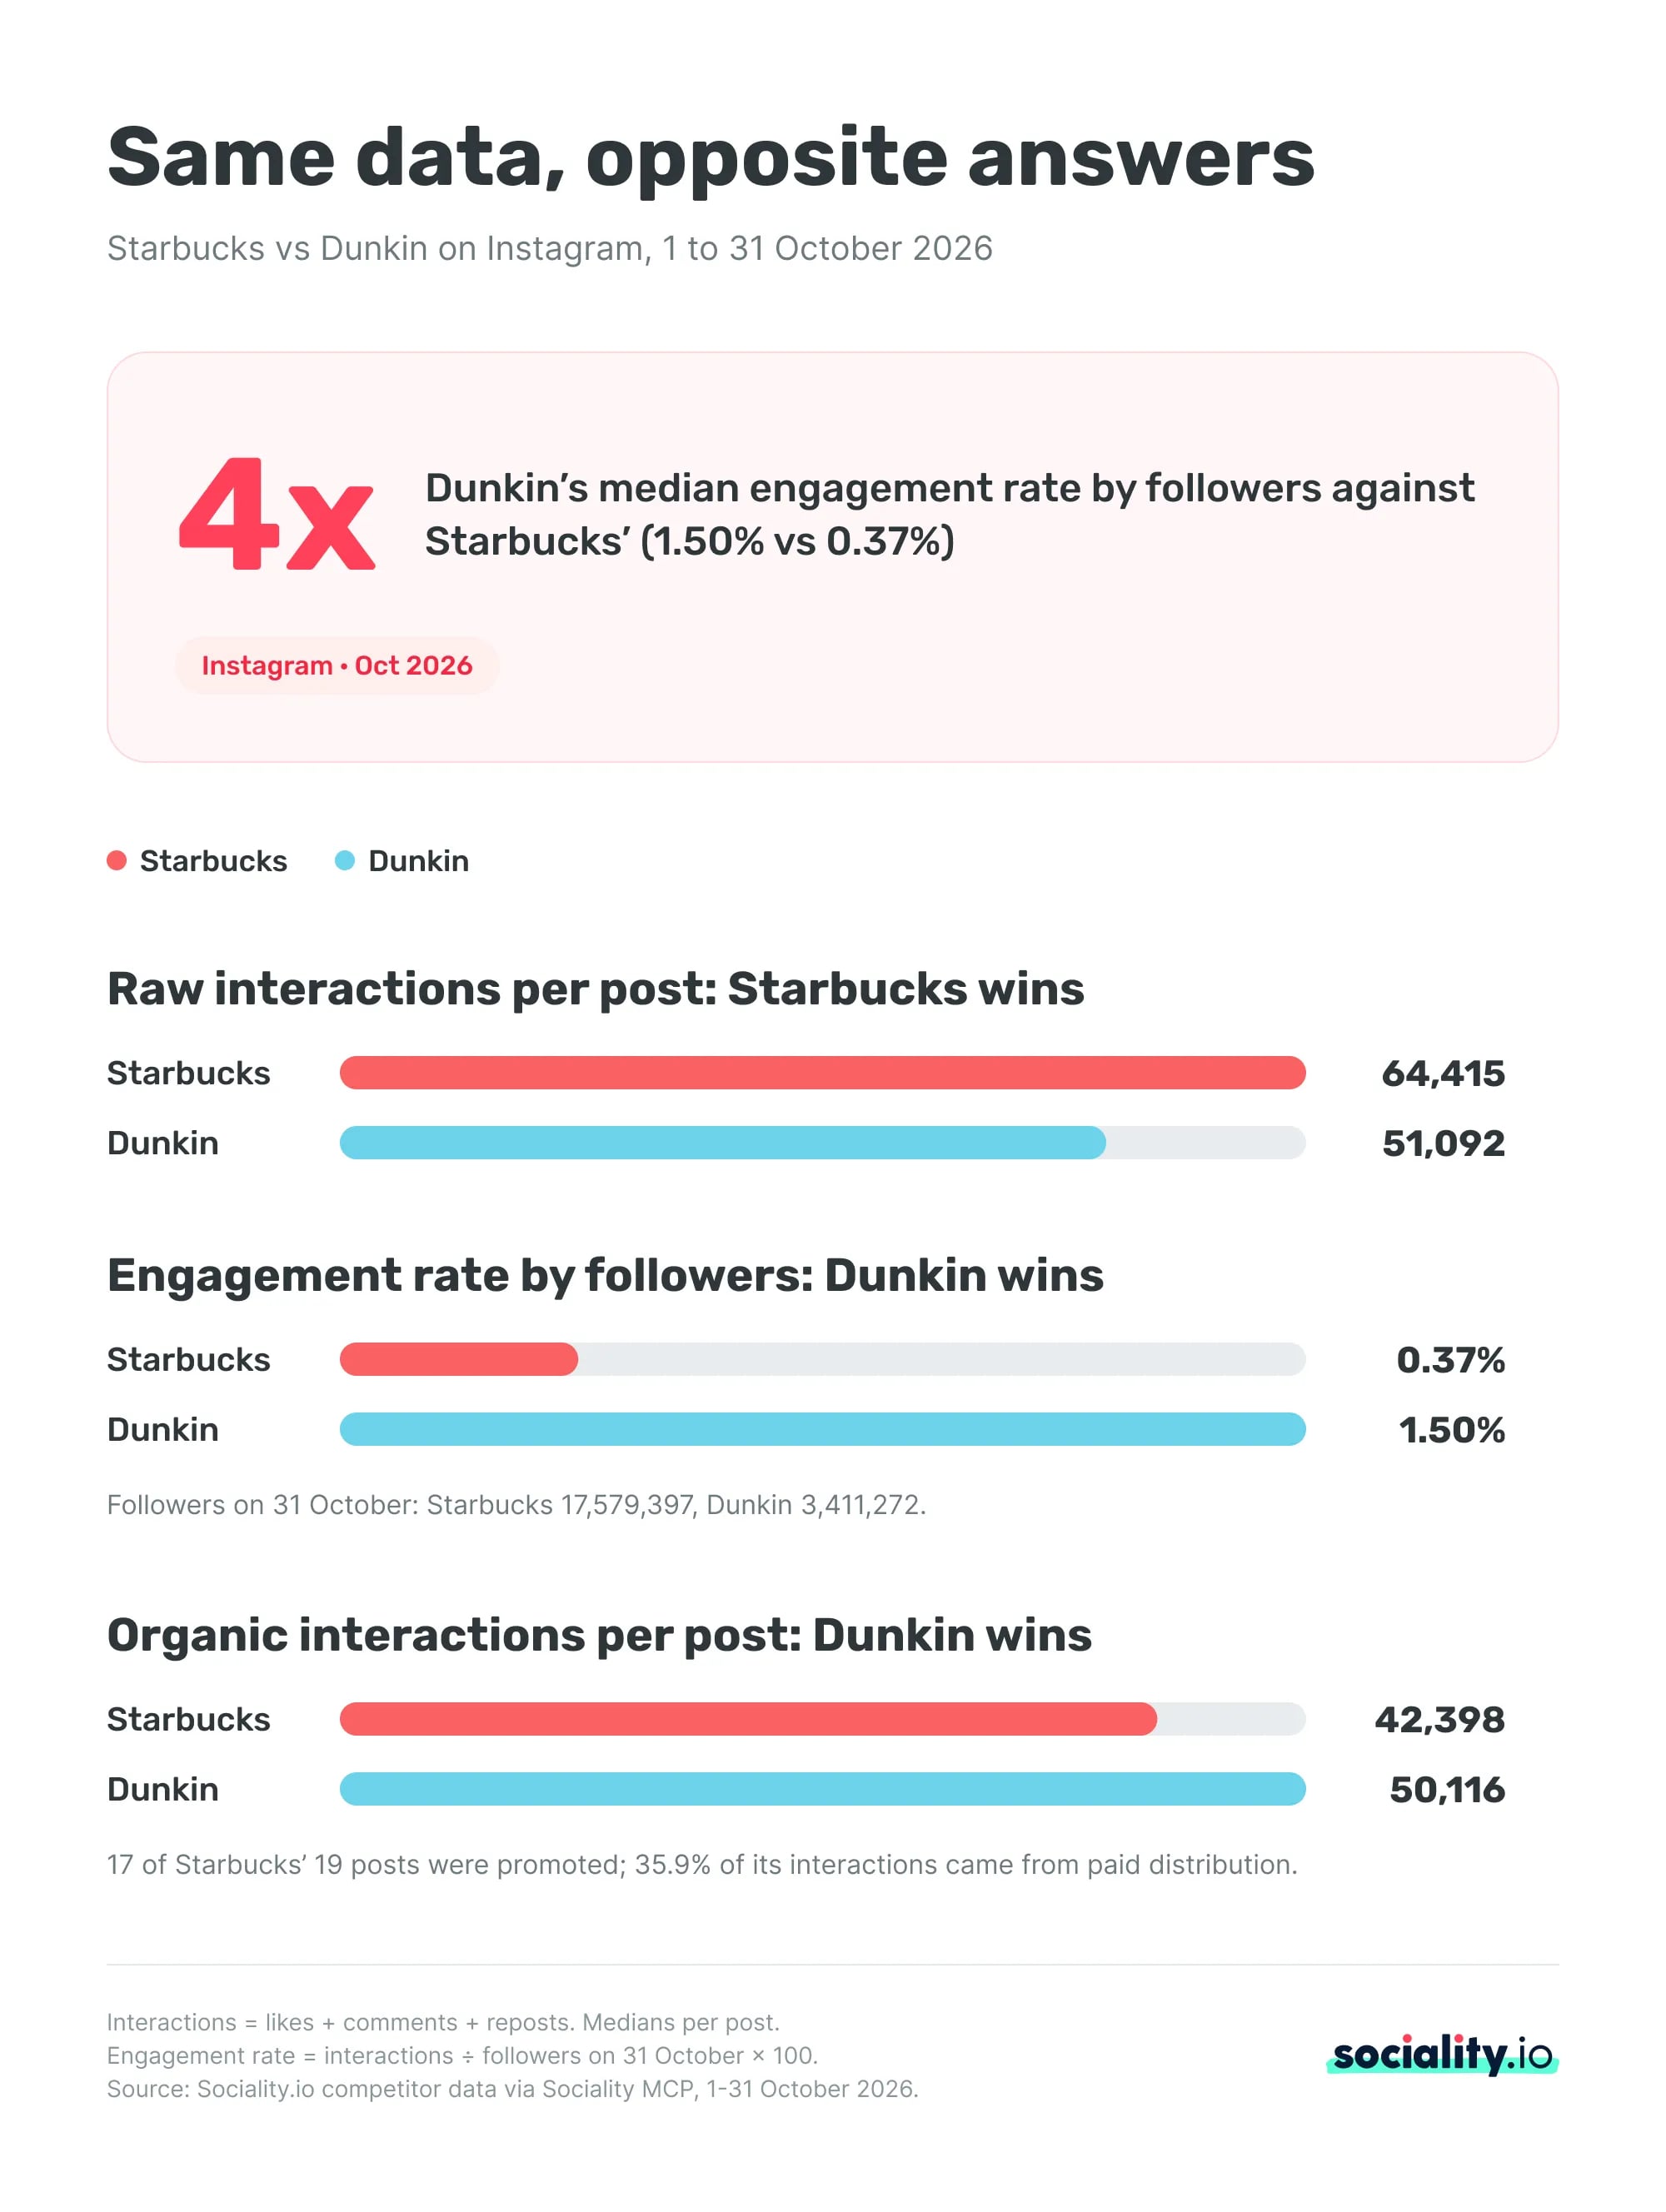
Why the ranking flips
Divide by followers and Dunkin’s median post reaches 1.50% engagement against 0.37% for Starbucks, about four times the rate. Split paid from organic and the gap holds: 17 of Starbucks’ 19 posts were promoted, 35.9% of its interactions came from paid distribution, and on organic interactions alone Dunkin’s median post beats Starbucks’ (50,116 against 42,398) with a fifth of the followers.
Same data, opposite answers. That’s why the engagement rate prompt and the paid vs organic prompt ask for the follower date and the paid split before any ranking. For this example, the better prompt reads:
“Compare Starbucks and Dunkin on Instagram for 1 to 31 October 2026. Calculate each post’s engagement rate by followers using followers on 31 October, report the median for each brand, and split interactions into paid and organic before you rank them. List the post IDs behind every number. If a figure isn’t in the data, write ‘not in the data’.”
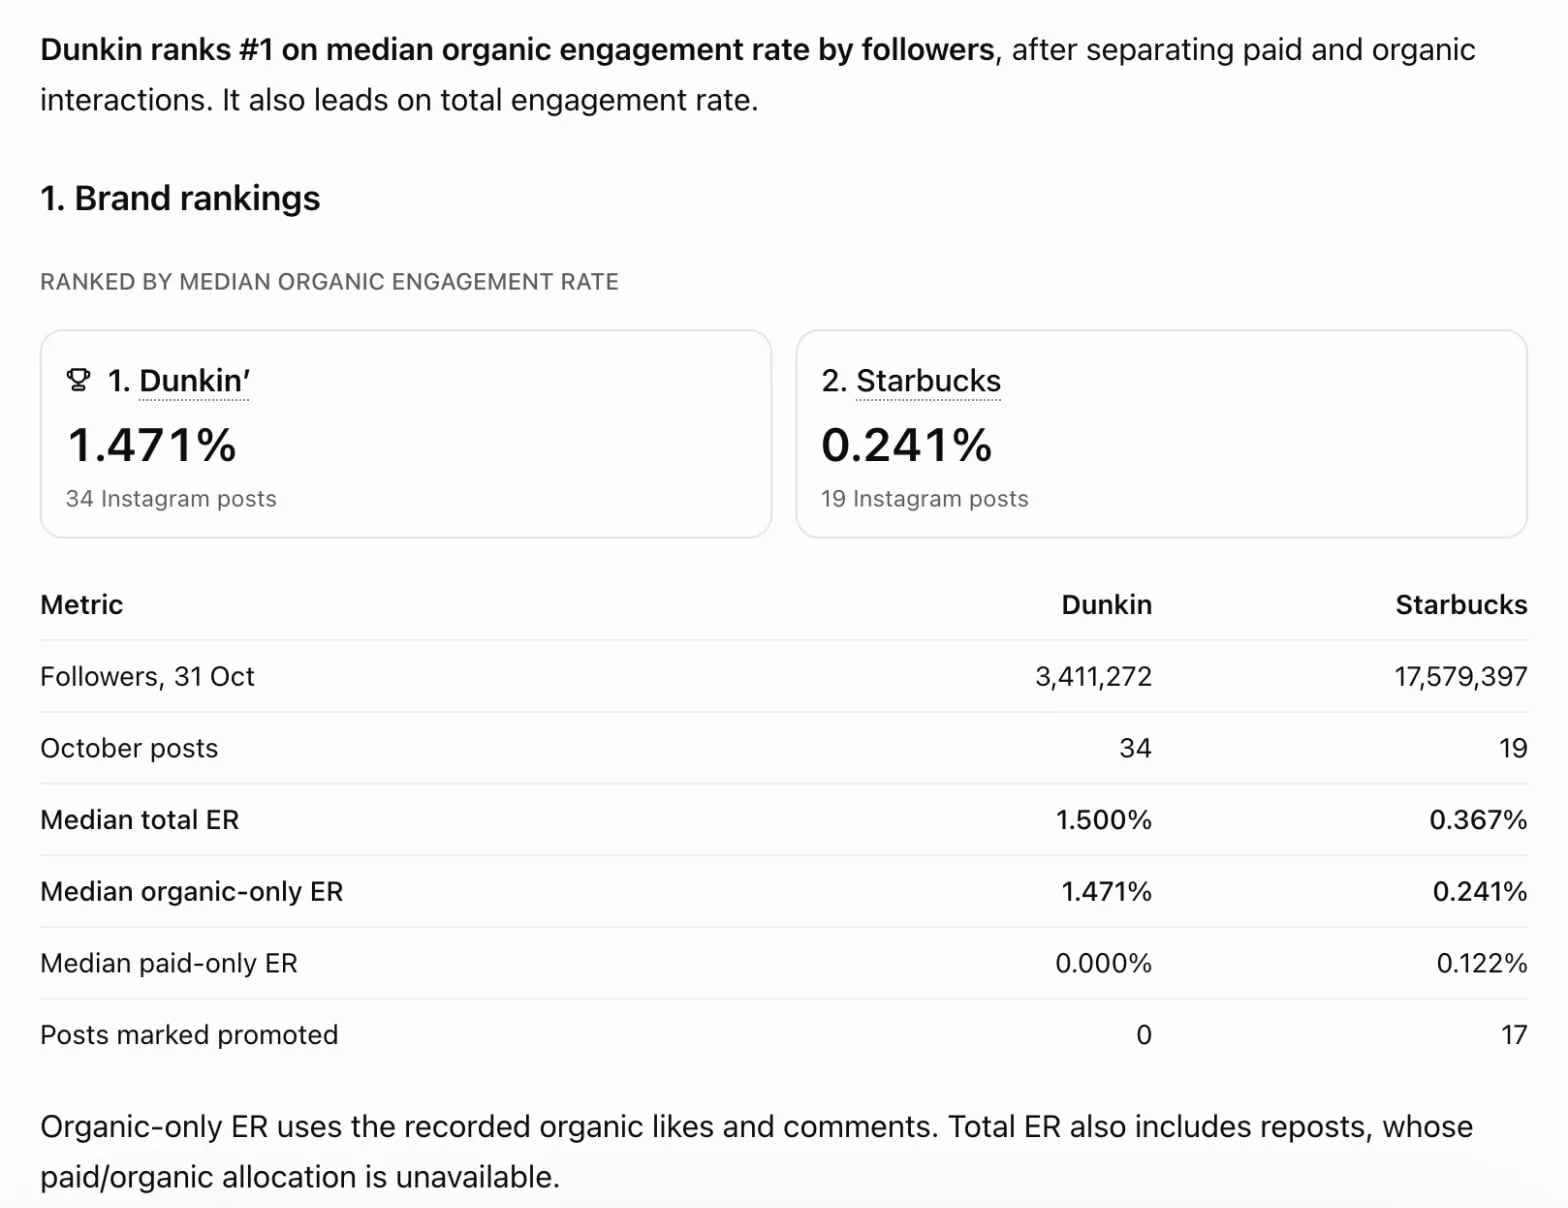
On a brand’s profile grid, a boosted post looks like any other, so you need a tool that flags it; here’s how to track competitors’ promoted posts on Instagram.
Competitor analysis AI prompts for social media
You don’t need a hundred prompts; you need a handful that think the way you do. Each one below assumes the data is already in the chat, from an export or a connection. Swap the brackets for your own accounts and dates, and keep the last line: it’s the one that stops the model from inventing a number. Think of them as shortcuts to speed, not scripts to follow.
1. Competitor overview and SWOT
I’d start here when you want the lay of the land, fast enough for a monthly check.
“Using the posts and follower data for [our brand] and [competitors] on [platform] for [date range], summarize each account’s posting frequency, format mix, median engagement rate by followers and top three posts. Then draft a SWOT for [our brand] against the group as a 4-cell table. Cite the post IDs behind every point. If a figure isn’t in the data, write ‘not in the data’.”
Needs: posts with dates, formats, likes and comments, and follower counts for the same period.
2. Content pillar audit
This one sits at the heart of a social media competitor audit: which topics each brand keeps coming back to.
“Classify every post in [dataset] for [brands] on [platform], [date range], into one content pillar. Use [our pillar list], or propose up to six pillars and define them. Return the count and share of posts per pillar for each brand, three example post IDs per pillar, and the posts you couldn’t classify. If a field is missing, write ‘not in the data’.”
Needs: post IDs, dates and captions, plus screenshots if the visuals carry the topic.
3. Top posts and what they share
“Rank the top [5] posts per brand in [dataset] by [metric] and show how you calculated it. For each, list the date, format, opening line and URL. Then name the patterns the top posts share, keeping ‘observed in the data’ apart from ‘possible explanation’, because a high number alone doesn’t prove why a post worked. If something isn’t in the data, write ‘not in the data’.”
Needs: post URLs, dates, formats, captions and engagement counts.
4. Posting cadence and format mix
“For [brands] on [platform] from [start date] to [end date], count posts per brand and per week, including weeks with zero posts, and the share of each format ([Reels, carousels, photos]). Show the date boundaries and denominators in a table. Don’t treat missing posts as inactivity unless the dataset is complete; if you can’t tell, write ‘not in the data’.”
Needs: the complete post list for the period, with dates and formats.
5. Engagement rate by followers
Use this whenever the accounts differ in size, which is almost always.
“For each post in [dataset], calculate engagement rate = interactions / followers × 100, where interactions = [likes + comments] for every brand, using the follower count from [date]. Leave out posts with missing counts instead of treating them as zero. Report the valid post count, median and range per brand, and show the working for three posts. If a figure isn’t in the data, write ‘not in the data’.”
Needs: likes and comments per post, and dated follower counts.
6. Paid vs organic
“Split each brand’s interactions in [dataset] into paid and organic, flag which posts were promoted, and rank the brands on organic interactions per post and organic engagement rate by followers. Show the share of interactions that came from paid distribution. If the data doesn’t say whether a post was promoted, write ‘not in the data’.”
Needs: a promoted flag and a paid/organic split per post, which public profiles don’t show.
7. Hooks, captions and calls to action
“For each post in [selected posts], quote the first line of the caption and name the hook type (question, claim, problem or other), the main message and the call to action. Group them, count each type with its denominator, and suggest [three] hooks we could test without copying anyone’s wording. If you can’t see the visual, write ‘not in the data’.”
Needs: captions and URLs, plus screenshots for the visual hook.
8. Comment sentiment snapshot
Numbers tell you reach. Sentiment tells you resonance.
“Classify each comment in [comments file] for [brands] as positive, negative, neutral or uncertain, marking sarcasm and mixed comments as uncertain instead of forcing a label. Report counts and percentages, the recurring questions, complaints and requests, and the comment IDs behind each theme. Don’t claim the sample speaks for the whole audience. If context is missing, write ‘not in the data’.”
Needs: comment text with comment and post IDs. For the wider conversation beyond your competitors’ own posts, AI social listening picks up mentions.
9. Campaign debrief
Every viral moment leaves clues.
“Debrief [campaign] by [brand] on [platform] from [start date] to [end date]. Compare the campaign posts ([how they’re tagged]) with the brand’s posts from [baseline period] on volume, format mix, topics, hooks and engagement. Show every post ID and calculation, and keep results apart from guesses about strategy. Don’t claim sales, reach or causation the data can’t show; write ‘not in the data’ instead.”
Needs: campaign posts and a comparable baseline period from the same account.
10. Content gap finder
This one finds whitespace: the spaces competitors fill and you don’t yet.
“Compare our posts with [competitors]’ posts on [platform] for [date range], using [pillar labels]. List topics they cover often and we rarely do, topics we own, and formats with enough posts to test. For each, give post counts, the performance comparison and the post IDs, a confidence level, and one test with a metric to watch. If evidence is missing, write ‘not in the data’.”
Needs: your posts and competitors’ posts for the same period, with pillar labels.
ChatGPT vs Claude for competitor analysis
Both can do this job. What separates them is how the data gets in and whether the analysis can repeat on a schedule, and both depend on your plan. Checked on 10 November 2026:
| What you need | ChatGPT | Claude |
|---|---|---|
| Web search | Free, Go, Plus, Pro, Business, Enterprise and Edu (OpenAI) | Available; on Team and Enterprise an Owner turns it on for the workspace (Anthropic) |
| Upload a CSV or spreadsheet | Free and paid plans, with plan limits (OpenAI) | CSV supported; XLSX needs code execution turned on (Anthropic) |
| Connect a custom MCP server | Pro: read/fetch. Business, Enterprise and Edu: full MCP (OpenAI) | Free (one custom connector), Pro, Max, Ultra, Team and Enterprise (Anthropic) |
| Run it on a schedule | Scheduled tasks on Free to Edu; Free at most once a day, paid plans up to hourly (OpenAI) | Scheduled tasks in Cowork on Pro, Max, Ultra, Team and Enterprise (Anthropic) |
One catch in ChatGPT: a scheduled task created inside a project can’t read the files stored in that project, so a monthly re-run works better from a connection than from an upload. Anthropic lists tracking competitors on a regular cadence as a use for Claude’s scheduled tasks. To see what else Claude plugs into, here are the best Claude connectors for marketers.
My take: pick the one your data connection works in, run the same export through both once, and check both answers against the source rows.
How to check ChatGPT’s competitor analysis before you share it
You could hand everything to AI and call it efficiency. But should you? OpenAI’s own help page asks users to verify important information from reliable sources, quotes and data included, and a competitor report is mostly quotes and data.
Seven checks before a competitor report goes out
- Confirm the account. Exact handle, profile URL and platform for every brand.
- Check the window. Every post and follower count sits inside the stated period.
- Trace every number. An export row, a post URL or a connected source with a collection date.
- Match the definitions. The same interaction formula for every account.
- Recalculate the rates. Denominators, follower dates, medians and missing values; missing is never zero.
- Open the top posts. Read the captions, formats and comment context before you accept an interpretation.
- Cut what the data can’t show. Reach, sales, audience makeup or the reason a post worked stay out unless you have the data; label the rest as a hypothesis.
If a number looks too neat, you could pull a native report. If a trend feels inflated, you might test it on a smaller timeframe. Those small checks build big credibility.
Where AI struggles in competitor analysis
AI still misses nuance. Irony, sarcasm, and cultural timing trip models up, which can skew sentiment reads or make praise out of a joke. Recent research highlights sarcasm detection as a persistent challenge even for advanced models (Knowledge and Information Systems, 2025).
So treat AI as your first-pass analyst, not your strategist: half of the marketers in our survey flag accuracy and hallucination problems. Also, Redditors say the same thing. AI is great, and it helps you listen faster; you still decide what matters.
Platform rules and the EU AI Act
Running an AI assistant over competitor data you collected legitimately is ordinary research. Collection is where platform rules apply: Meta, LinkedIn and TikTok all limit automated collection, so stick to exports, official APIs or a tool with permitted access.
On the EU AI Act, the rules that started in August 2025 apply to providers of general-purpose AI models, the companies behind tools like ChatGPT and Claude (European Commission). The transparency rules that came into effect in August 2026 cover chatbots, the marking of AI-generated content, deepfakes and AI-generated text published to inform the public on matters of public interest. An internal competitor report isn’t one of those cases; if yours will be published, check the rules for that use with your legal team. A line in the method section, such as “AI-assisted summary, figures checked against source data,” still helps readers trust the numbers.
Wrapping up
Let AI do the mechanical work: the counting, clustering, and summarizing. But don’t hand it your judgment. It might see patterns, yet you feel context.
Competitive analysis with ChatGPT pays off when the model works from real data: the right accounts, one period, the same definitions and numbers you can trace back to a post. Start with two or three prompts from the library, check the answer against the source, and run the same method next month.
AI could write the report inside a chat connected to your social media management dashboard through MCP, but only you would know what it really means.
FAQs about competitive analysis with ChatGPT
Can ChatGPT see my competitors’ Instagram analytics?
Not on its own. ChatGPT can’t sign in to another account, so private insights such as reach, saves and audience demographics stay out of reach. It can work with public post counts you upload or that a connected tool returns. Sociality MCP gives ChatGPT the follower counts and post-level engagement of the competitors you track in Sociality.io, so you can ask for the comparison in the chat.
What data should I give ChatGPT for a competitor analysis?
Give it each account’s handle and, for every post, the URL or ID, date, format, caption, likes and comments. Add follower counts for a fixed date if you want engagement rate by followers, and screenshots when the visuals matter. Use the same period for every competitor. If a field is missing, leave it blank and tell the model not to estimate it.
Is ChatGPT or Claude better for competitor analysis?
Either can do it well. Both read uploaded CSV files, search the web and connect to MCP servers, so the choice usually comes down to your plan. In ChatGPT, custom MCP is read/fetch on Pro and full on Business, Enterprise and Edu, while Claude allows one custom connector even on Free. Run the same export through both once and check each answer against the source.
What is social media competitive analysis?
Social media competitive analysis is the process of tracking competitors’ social accounts to see what they post, how their audience responds and how your results compare. It covers posting frequency, formats, engagement rate, follower growth, content themes and comment sentiment. AI speeds up the sorting and summarizing, but the comparison still depends on clean data and the same definitions for every account.
Can AI analyze competitors’ social content for useful insights?
Yes, if you give it a dated post dataset. AI can group posts into content pillars, compare formats, spot recurring hooks, cluster comment themes and summarize engagement patterns. What it can’t do is prove from engagement counts alone why a post worked. Open the top posts yourself, review anything it labels as sarcasm or mixed, and keep hypotheses apart from measured findings.
Is it legal to use AI for competitor analysis?
Running an AI assistant over competitor data you collected legitimately is ordinary research; the rules bite at collection. Meta says automated collection without its permission breaks its terms, LinkedIn doesn’t allow scraping software and TikTok’s Research API excludes commercial users. The EU AI Act’s transparency rules target chatbots, deepfakes and AI text published on matters of public interest. Check with your legal team before you publish.
How often should I run a competitor analysis with ChatGPT?
Monthly suits most content teams: a calendar month, with the same accounts, metrics and formulas each time, so the trend means something. Add a weekly check during a competitor’s big campaign or your own launch. ChatGPT and Claude can both run scheduled tasks on eligible plans, but confirm each run pulled fresh data instead of reusing last month’s numbers.