
Engagement rate is the share of your audience that interacts with a post, written as a percentage. To calculate it, add up the post’s engagements (likes, comments, shares, saves and, on some platforms, clicks), divide by followers, reach, impressions or views, and multiply by 100. Which of those four you divide by changes the answer, sometimes by a factor of a thousand.
Remember the days when metrics like followers, likes, and impressions were the be-all and end-all? Well, those days are gone. Sort of.
Sure, these metrics still count for something, but what do they really tell you about your social media performance? Not as much as you’d think. Engagement rate is the real litmus paper: it tells you whether the people who saw a post did anything about it, which is why it’s the metric du jour for gauging the ROI on your latest campaign, or for vetting influencers before you sign them.
This article covers the four formulas, how Instagram, Facebook, X, LinkedIn, TikTok and YouTube count engagement today, a worked example with real numbers, and benchmarks that use the same math as the formula you pick.
Key takeaways
- X calculates engagement rate as engagements divided by impressions, and some of those engagements, like link and profile clicks, are visible only to the account owner.
- LinkedIn’s Page engagement rate counts clicks, reactions, comments and shares per impression, and leaves follows out.
- TikTok’s campaign reporting divides likes, comments and shares by video views.
- Views now count differently: Meta replaced impressions and plays with views in the Instagram API in April 2025, and YouTube counts a view the moment a video starts to play from August 24, 2026.
- By followers, the median brand post earned 0.30% on Instagram, 2.01% on TikTok and 0.03% on X in 2025.
What is engagement rate?
The engagement rate calculates the level of interaction your brand’s social media content garners in relation to your audience size and reach.
On top of the formula sits a count of actions: likes, comments, shares, saves, reposts and, on X and LinkedIn, clicks. Views, impressions and reach don’t belong up there. They’re exposure, so they go underneath, where they decide what your percentage means. One more thing trips people up: the result counts actions, not people, so someone who likes, comments on and shares a post adds three.
There are different ways to measure engagement rates, depending on your objectives, social media strategy, and chosen platforms.
Why track engagement rates?
Gaining new followers is great. But it won’t do much for your brand if your new audience doesn’t connect with your content.
Your content needs to resonate with your audience if you want it to drive sales, brand awareness, and growth. Engagement rate is the quickest check on whether it does, and because it’s a ratio, you can compare a post from a 5,000-follower account with one from a 500,000-follower account without the bigger account winning by default. It won’t show revenue on its own, so read it next to clicks and conversions.
What counts as an engagement?
The numerator is whatever your social media team agrees to count as an engagement. Pick a set, write it down and use it every time, because the list moves the result more than the math does:
| Count it | Leave it out |
|---|---|
| Likes and reactions | Views, impressions and reach (they’re the denominator) |
| Comments and replies | Direct messages and brand mentions, which belong to the account, not the post |
| Shares, reposts and retweets | New followers and profile visits, unless the platform counts them (X counts follows from a post) |
| Saves | Anything you can’t get for every post in the comparison |
| Clicks on links, hashtags and media (X and LinkedIn) |
Use a platform’s own total or add up the parts, not both. Instagram’s total interactions metric already includes saves, for example, so adding saves again counts them twice.
If you’re getting high numbers of these metrics, chances are you’re doing something right.
4 ways to manually calculate engagement rate
Each formula answers a different question, so pick the one that matches what you can see and what you’re comparing. E stands for a post’s engagements, and every formula ends with × 100.
| Formula | Calculation | Best for | Watch out for |
|---|---|---|---|
| By reach (ERR) | E ÷ reach × 100 | Your own posts | Reach is private, so it won’t work for competitors |
| By views | E ÷ views × 100 | Reels, TikTok, YouTube and other video | Views include rewatches, so they aren’t unique people |
| By followers | E ÷ followers × 100 | Comparing public accounts, competitors and creators | Non-followers engage too, especially on video |
| By impressions | E ÷ impressions × 100 | X and LinkedIn, and paid posts | Impressions repeat, so the rate is lower than by reach |
1. Engagement rate by reach (ERR)
Let’s start with ERR, the one you can work out for any post in your own insights.
ERR shows how many interactions a post earned for every 100 accounts that saw it. It can be calculated for a single post:
| ERR = Engagements on the post ÷ reach of the post × 100 |
Alternatively, it can be used to calculate the average engagement across multiple posts. Simply tally all the ERRs from the posts you want to include and divide the total by the number of posts:
| Average ERR = Sum of each post’s ERR ÷ number of posts |
ERR is a good default for your own posts because it only counts accounts that were actually shown the post. After all, your followers won’t see all of your posts, and some users who aren’t your followers will see your content.
On the other side of the coin, reach is a tricky variable to control. A post with very low reach can show an extremely high engagement rate that flatters it, so read ERR next to the reach number. Reach is also private: you only see it for accounts you manage, so ERR can’t compare you with a competitor. And because ERR counts actions, it isn’t the share of people who engaged. On Instagram, that number is accounts engaged ÷ accounts reached × 100.
2. Engagement rate by views (ER views)
Video reigns supreme these days. So, if the majority of your brand’s content is video, you will want to know how many viewers are engaging with your videos. This is known as ER views.
You can calculate this per video:
| ER views = Engagements on the video ÷ video views × 100 |
Or, you can work out an average ER views based on a number of videos:
| Average ER views = Sum of each video’s ER views ÷ number of videos |
ER views are a fantastic way to gauge how much engagement your videos are garnering. That said, it’s important to remember that the total number of views usually includes repeat views from the same user.
Just because the user watched the video more than once doesn’t necessarily mean they engaged with it all of those times.
Views also changed meaning recently. Meta replaced plays and impressions with views in the Instagram API on April 21, 2025, after making the same switch in Facebook Page insights in November 2024, and YouTube started counting a view the moment a video starts to play on August 24, 2026. A views-based rate from before one of those dates isn’t a like-for-like comparison with one from after it.
3. Engagement rate by followers (ER per post)
This is a favorite amongst social media influencers. Similar to ERR, ER measures the overall engagement rate on a specific post.
However, it differs from ERR because it divides by followers instead of reach. Follower counts are public, so it’s the one formula you can calculate for any account, which is why benchmark studies and influencer tools use it.
You can calculate the ER per post:
| ER = Engagements on the post ÷ followers × 100 |
Or, you can calculate the average ER by adding up the ER on a selection of posts and dividing the total by the number of posts:
| Average ER = Sum of each post’s ER ÷ number of posts |
The catch is that non-followers engage too, and on Reels and TikTok they can be most of the audience, so a follower-based rate can undersell a video that travelled well beyond your followers. Write down the follower count on the day you measure, because it moves.
Since ER doesn’t factor in reach, we recommend comparing ER with other growth analytics for a full picture of your engagement efforts.
4. Engagement rate by impressions (ER impressions)
If you’ve got a social media strategy in place, you’re probably using paid ads. ER impressions is a great metric to track the success of those ads in terms of engagement, and it’s also the formula X and LinkedIn use in their own analytics.
Unlike reach, which tracks how many users see your social media content, impressions measure how many times your content appears on a user’s screen. On Instagram and Facebook, organic impressions have been replaced by views, so this formula now lives mostly on X, LinkedIn and in ads reporting.
Bonus read: What’s more important: Reach vs. impressions?
Here’s how to figure out ER impressions:
| ER impressions = Engagements on the post ÷ impressions of the post × 100 |
If you want to work out the average ER impressions across multiple posts, you simply add up the ER impressions for each post and divide by the total number of posts:
| Average ER impressions = Sum of each post’s ER impressions ÷ number of posts |
There’s no doubt that this is a handy metric to track, especially if you want to measure the engagement of paid content based on impressions. But, it should not be used alone.
One person can see a post several times, so impressions are always at least as high as reach, and the same post’s rate by impressions is never higher than its rate by reach. So, while it’s certainly valuable, compare it only with other impressions-based rates.
Average engagement rate: mean or total?
Each average formula above is a mean of post rates, so every post counts the same. The other option is to pool: add up all the engagements, add up all the denominators, and divide once. The two give different answers whenever posts differ in size.
Take two posts: 10 engagements on a reach of 100 (10%) and 10 engagements on a reach of 1,000 (1%). The mean is 5.5%. The pooled rate is 20 ÷ 1,100 × 100 = 1.82%.
Neither is wrong. The mean tells you how a typical post did, the pooled rate tells you how the account did overall, and when one viral post skews the mean, the median of your post rates is the fairer typical number. Whichever you report, say which, and keep it the same every month.
Engagement rate example: one Reel, two answers
Here’s how much the formula matters, using public numbers from a Red Bull Instagram Reel posted on October 31, 2026. On November 2 it had:
| Input | Value |
|---|---|
| Likes | 718 |
| Comments | 7 |
| Reposts | 19 |
| Engagements (total) | 744 |
| Views | 20,150 |
| Followers (October 1) | 34,320,004 |
- By views: 744 ÷ 20,150 × 100 = 3.69%
- By followers: 744 ÷ 34,320,004 × 100 = 0.0022%
Same post, same day, and one answer is about 1,700 times the other. The views-based rate says the people who watched the Reel responded at a healthy clip. The follower-based rate says almost none of Red Bull’s 34 million followers did anything with it, which mostly reflects how few of them were shown it.
We pulled the whole month through Sociality’s MCP server, asking Claude for every post Red Bull published on Instagram in October 2026. Across all 124 posts, the median rate by followers was 0.06% and the mean 0.30%; for the 120 videos, the median rate by views was 2.52%. A few viral Reels pushed the follower mean to five times the median, which is the mean-or-median choice in real life.
Saves and shares aren’t public on Instagram, so any calculation from outside the account uses likes, comments and reposts only. Red Bull’s own team, with saves and shares in the numerator, would get higher numbers.
How each platform calculates engagement rate
Platforms don’t agree on what goes on top or underneath, which is why a native dashboard rarely matches a calculator. Here’s what each one counts as of November 2026.
| Platform | What counts as an engagement | Divide by |
|---|---|---|
| Likes, comments, saves and shares (reposts are reported separately) | Reach or views for your own posts, followers for anyone else’s | |
| Content interactions, such as reactions, comments and shares | Reach or views | |
| X (Twitter) | Every action on the post, including clicks and follows | Impressions |
| Clicks, reactions, comments and shares | Impressions | |
| TikTok | Likes, comments and shares | Video views |
| YouTube | Likes, comments and shares (no native rate) | Views |
Instagram engagement rate
Instagram Insights gives you the inputs: interactions (likes, comments, saves and shares), accounts engaged (the unique accounts that interacted), reach and views. In the API, a post’s total interactions are likes, saves, comments and shares, net of any that were undone, and reposts are counted on their own.
For your own posts, divide interactions by reach, or by views for Reels. For someone else’s account you only have public numbers, so it’s (likes + comments) ÷ followers × 100, the same formula you use to compare competitors’ Instagram engagement rates. That’s roughly what free Instagram engagement rate calculators do, each with its own twist: some take the median of the last few posts, some count only likes. That’s why two calculators rarely agree on the same account. Our Instagram analytics guide shows where each metric lives.
Facebook engagement rate
Facebook Page insights in Meta Business Suite report Views, content interactions and link clicks. Since November 2024, Views has replaced impressions for posts and Plays for videos, while reach stayed the same. For a post, use content interactions ÷ reach × 100, or ÷ views for video, and keep link clicks out unless you count clicks on every platform you compare. The Facebook analytics guide covers where each number sits now. For other Pages, where reach is private, here’s how to compare engagement with competitors’ Facebook Pages.
X (Twitter) engagement rate
X divides engagements by impressions. That’s the engagement rate definition in X’s own metrics documentation, and followers don’t come into it:
| X engagement rate = Engagements ÷ impressions × 100 |
An engagement on X is any action on the post: likes, replies, reposts, quotes, follows, detail expands and clicks on links, hashtags, media, the post’s permalink and your profile. A post with 300 engagements and 15,000 impressions has a 2% engagement rate.
There’s a catch for competitor research. Impressions are public on every post, but total engagements, link clicks and profile clicks are only available to the account owner. So for someone else’s post you can only work out (likes + replies + reposts + quotes) ÷ impressions × 100, which comes in at or below X’s own number for that post. To find your own numbers, see the Twitter analytics guide.
LinkedIn engagement rate
LinkedIn defines a Page post’s engagement rate as interactions per impression, where interactions are clicks, reactions, comments and shares. Follows aren’t part of it. Because clicks are in and impressions are underneath, a LinkedIn rate isn’t comparable with a follower-based rate from Instagram. Our LinkedIn analytics guide covers the rest of LinkedIn’s Page metrics.
TikTok engagement rate
TikTok’s campaign reporting in TikTok One calculates engagement rate by dividing likes, comments and shares by video views. Favorites aren’t in that sum. For your own videos, the Overview tab lists likes, comments and shares next to views, so you can run the same formula yourself. The TikTok analytics guide shows where each number is.
YouTube engagement rate
YouTube doesn’t define a social engagement rate, so the usual calculation is (likes + comments + shares) ÷ views × 100 for each video. Watch the date range: YouTube has counted a view the moment a video starts to play in all formats since August 24, 2026, and Shorts switched to that counting in March 2025, so the same response divided by more views gives a lower rate after the change. Our YouTube analytics guide covers the rest of YouTube Studio.
What is a good engagement rate?
You’re probably wondering what’s considered a ‘good’ engagement rate.
It depends on the formula, so a benchmark only helps if it was calculated the same way as your number. The 1% to 5% range you’ll often see quoted rarely says which formula it uses, so we’d rather give you numbers with their math attached.
One of the few current studies with a published method is Rival IQ’s 2026 Social Media Industry Benchmark Report. It looked at 150 randomly picked companies in each of 18 industries during 2025 and divided interactions per post by followers:
| Platform | Median engagement rate per post, by followers (2025) |
|---|---|
| TikTok | 2.01% |
| 0.30% | |
| YouTube | 0.21% |
| X | 0.03% |
The report doesn’t give a new Facebook median and doesn’t cover LinkedIn. Rival IQ sells social analytics software, but no independent study covers these platforms with a published method, which is why we use it.
These are follower-based medians, so hold them against your follower-based rate, not against X’s impressions rate or a views-based Reel rate. For a sense of scale, Red Bull’s October 2026 median on Instagram was 0.06% by followers, a fifth of the brand median.
Don’t worry if you’re outside those numbers, though. The more useful benchmark is your own: track the same formula every month, against two or three competitors measured the same way, and you’ll know what good looks like for your account.
Common engagement rate mistakes
Most engagement rate arguments in a reporting meeting come down to one of these:
- Mixing formulas. Comparing your X rate (by impressions) with a competitor’s Instagram rate (by followers), or with a benchmark that used a different denominator.
- Counting exposure as engagement. Views, impressions and reach go underneath, never on top.
- Counting the same action twice. Adding saves to Instagram’s total interactions, which already include them.
- Using followers for short video. A Reel or TikTok that travelled beyond your followers looks weak by followers and strong by views.
- Averaging without saying how. Mean, median and pooled rates can differ by a factor of five on the same month of posts.
- Comparing across the view-count changes. Views before and after Meta’s April 2025 switch and YouTube’s August 2026 change don’t count the same thing.
- Treating missing as zero. A post with no reach data has no rate, not a 0% rate, and a metric a platform doesn’t report isn’t zero.
Best way to calculate engagement rate
Even with an engagement rate calculator, working rates out manually can be time-consuming and headache-inducing.
Fortunately, you don’t have to be an expert social media analyst to work out engagement rates (although having one on your team certainly helps).
Social media management tools, such as Sociality.io, do the math for you. Sociality.io tracks engagement and interaction rates for Facebook, Instagram, LinkedIn, YouTube and TikTok accounts, and on Instagram you can sort your posts by engagement rate to see what worked. You can also pull a customized social media report with the engagement metrics your team needs.
This is how engagement data looks in Sociality.io’s reports:
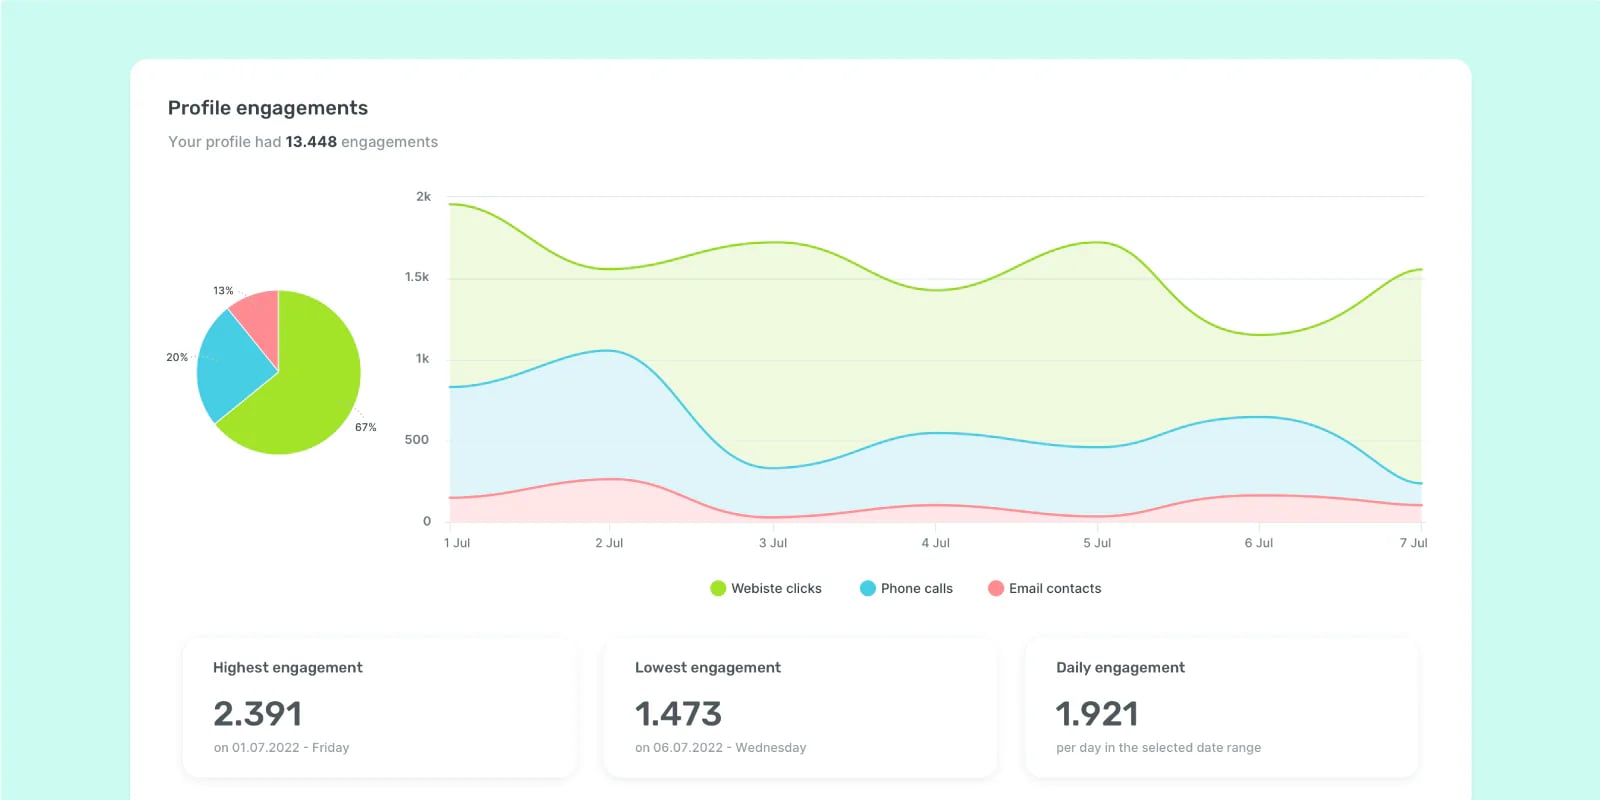
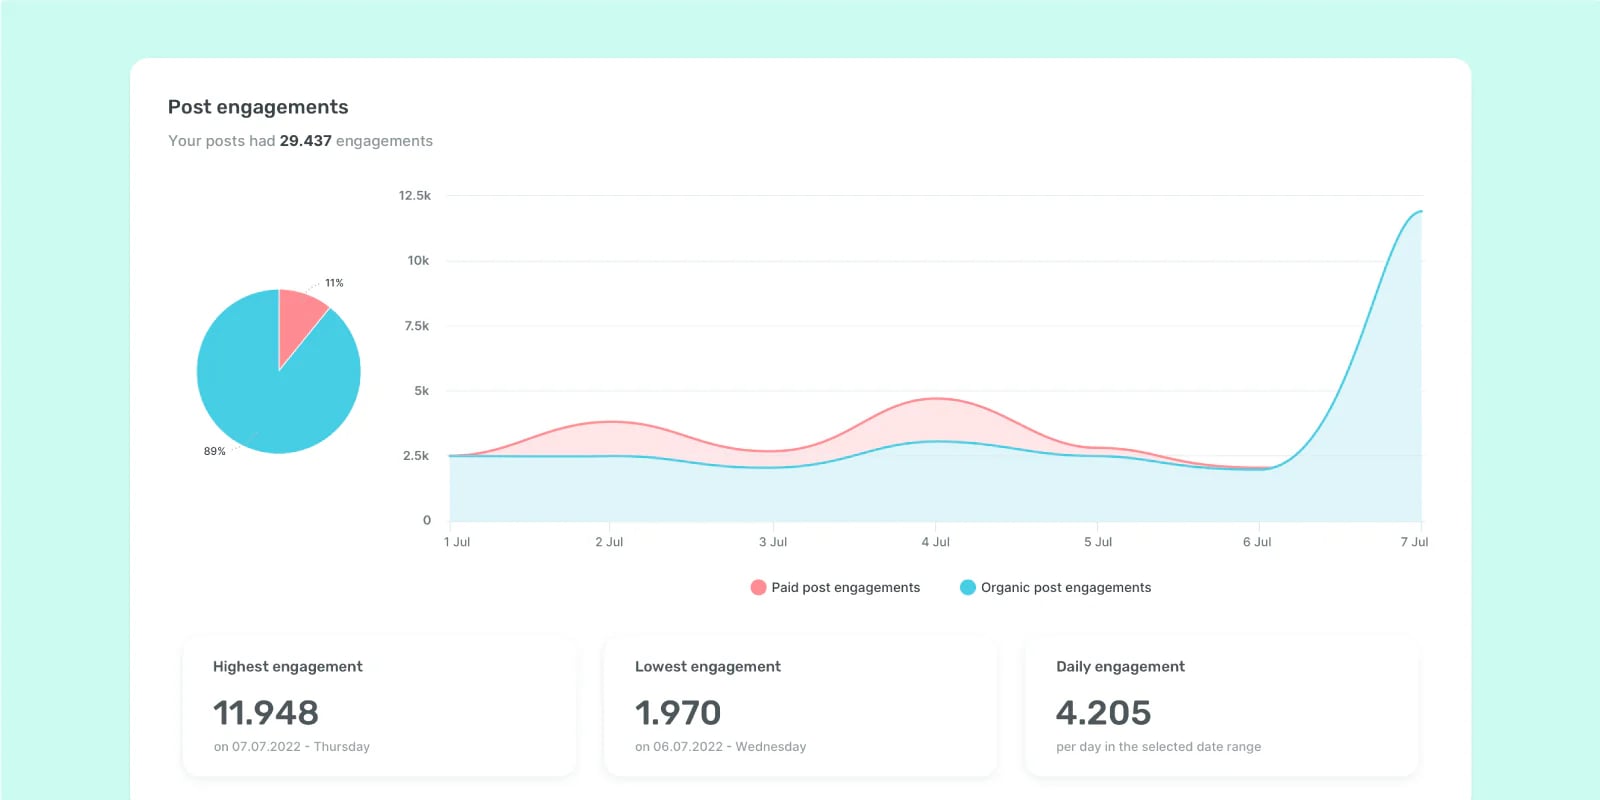
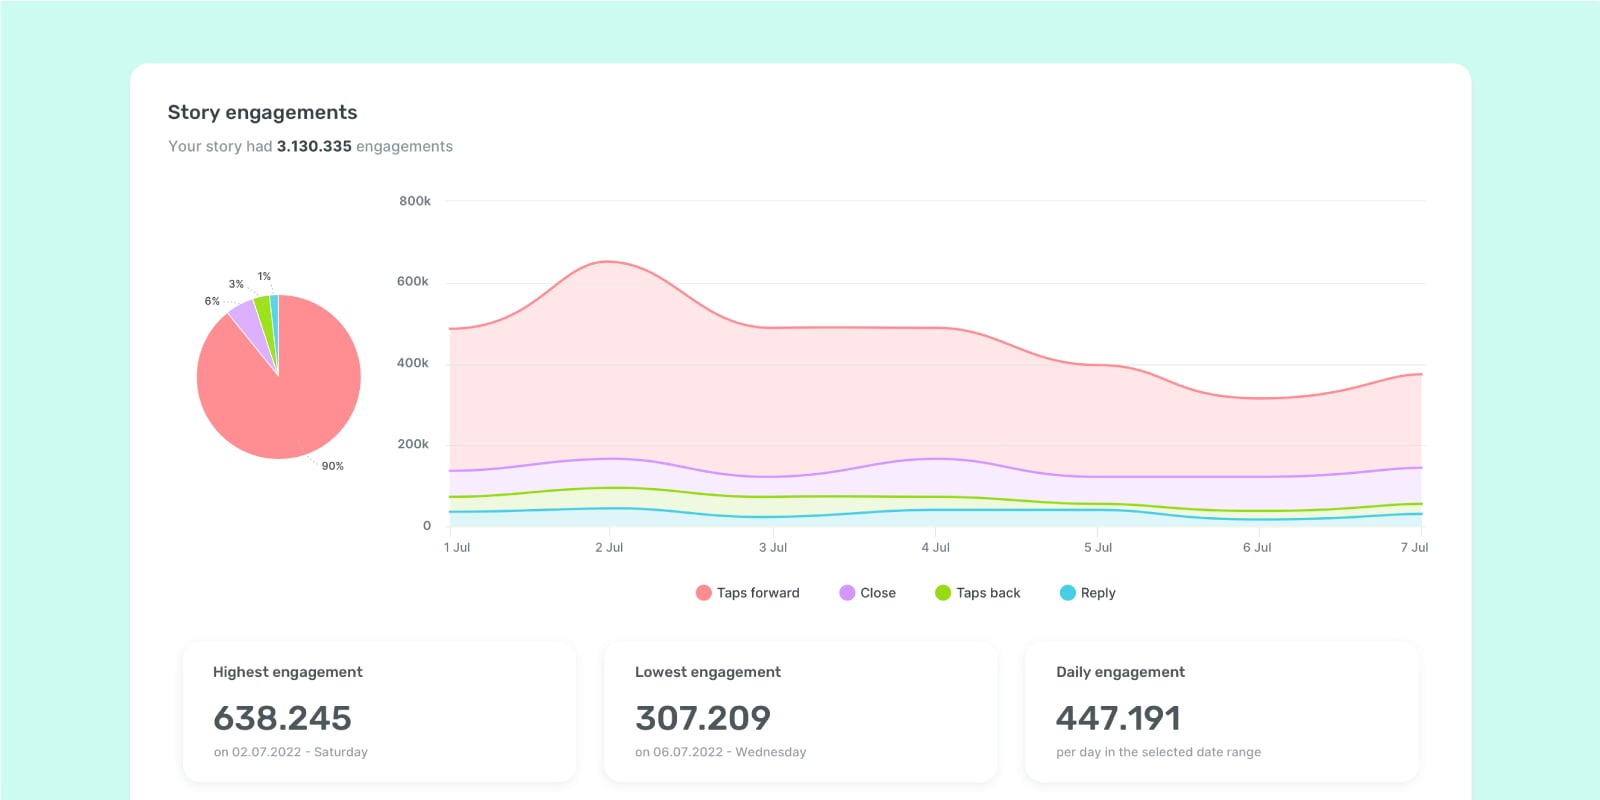
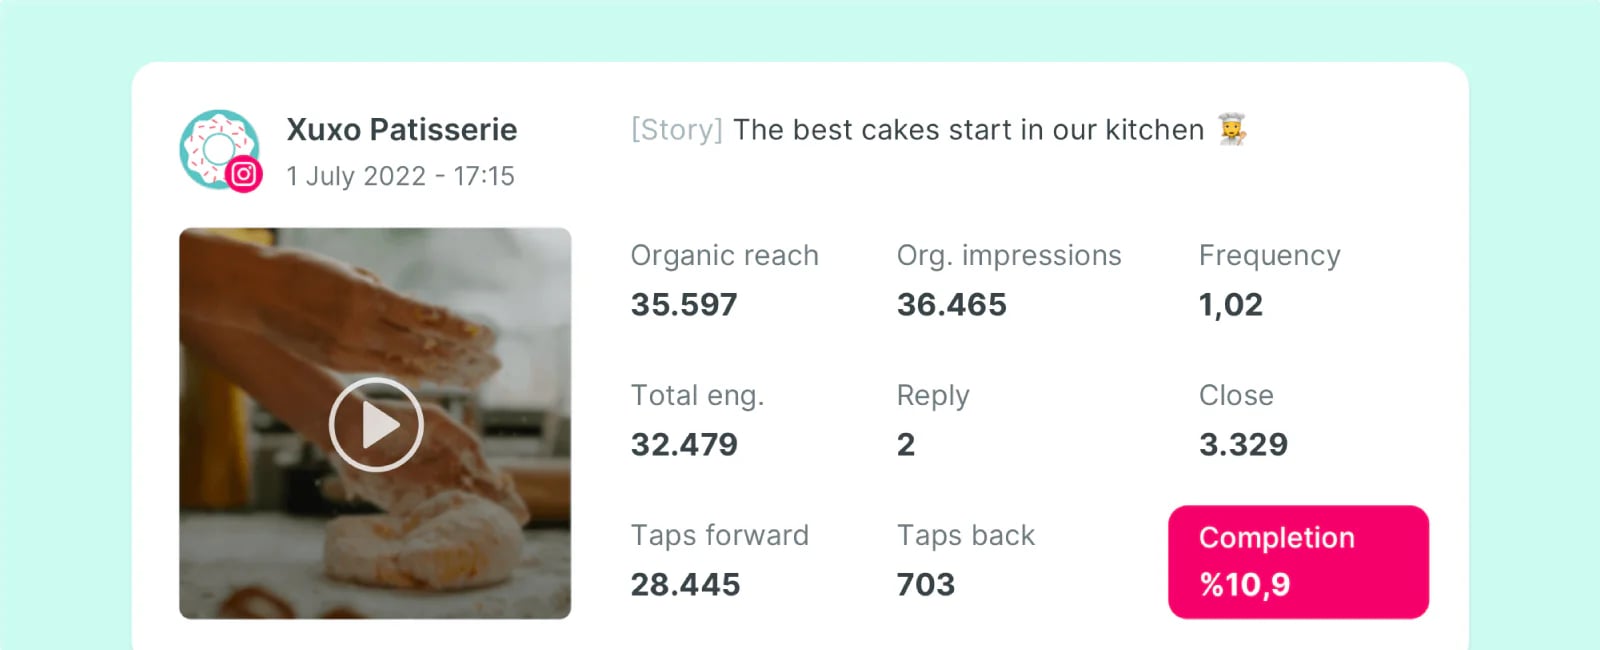
Sociality.io comes with powerful social media analytics so you can calculate your engagement for every post or track your overall performance from a high level. That way, you can see the types of posts that garner high engagement rates and tweak your strategy to add more of those.

You can extract valuable social media insights to see where you’re garnering high engagement and where you’re falling down.
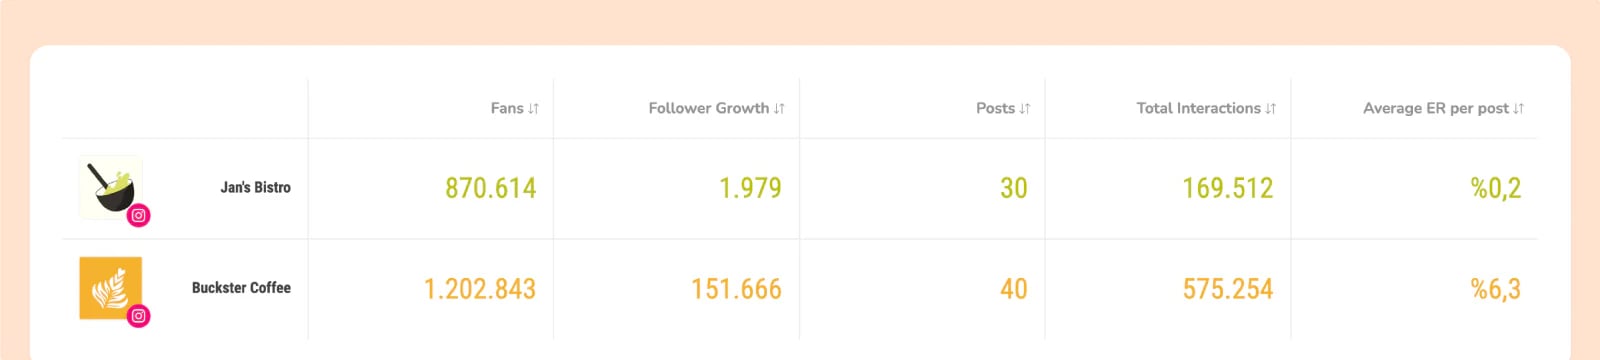
Compare your engagement rate with competitors
Success is relative. Competitor benchmarking is a powerful way to see how your engagement rate stacks up against your competitors and the top industry leaders.
Sociality.io’s Competitor Analysis tracks Facebook Pages, Instagram business accounts and YouTube channels, and its reports show follower trends, post volume, likes, comments, engagement rate and top posts for up to 15 pages side by side.
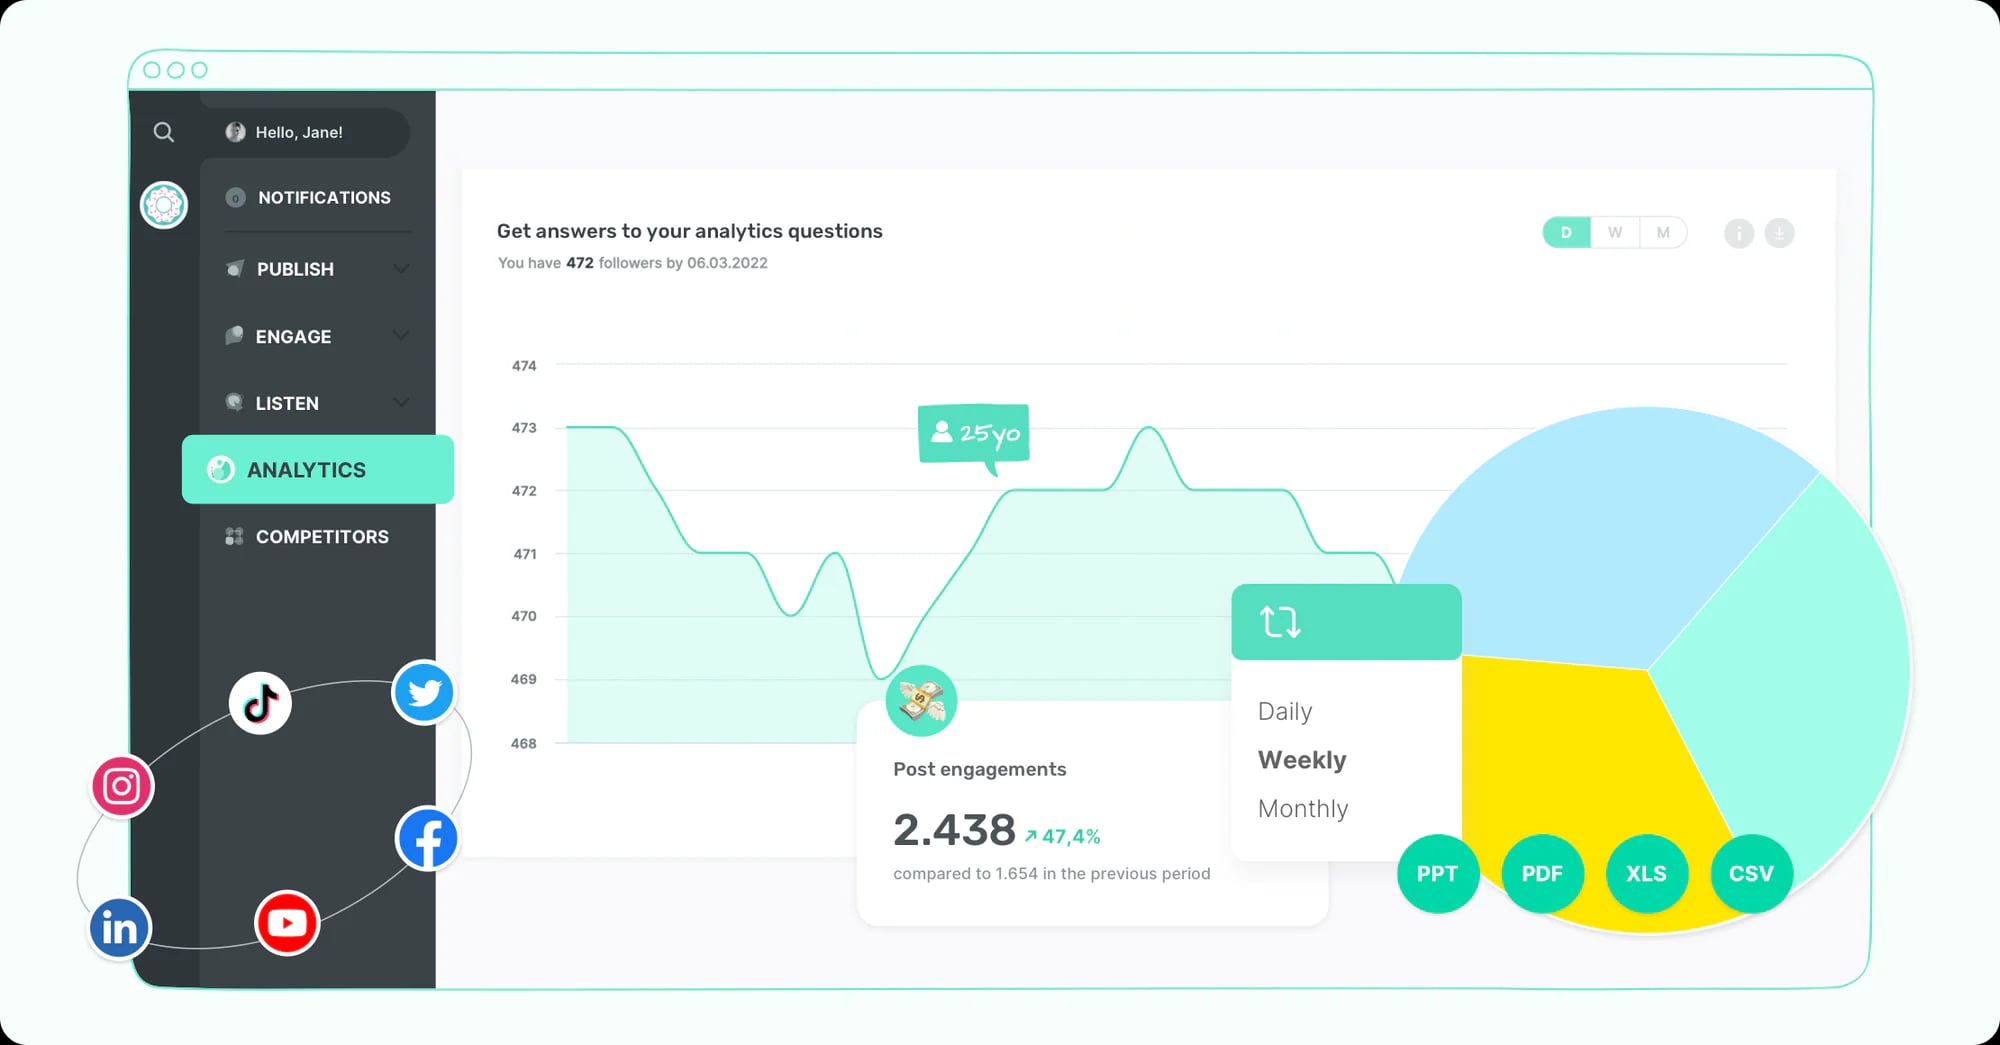
The Analytics module allows you to track essential social media metrics on all your posts across multiple platforms.
Worth a read: What is KPI reporting?
With a goldmine of data at your fingertips, you can check your engagement rate over a specific time period and compare the results to previous social media campaigns.
To stay in the loop, schedule reports to be created automatically and sent to your team.
In closing
That’s everything you need to know about how to measure your brand’s social media engagement. We hope it helps.
Pick one formula per platform, write it down and use it every month. Sociality.io can track engagement rate for your accounts and competitors at scale (no calculators necessary). Start your free trial today.
Engagement rate FAQs
Can a tool calculate engagement rate for my accounts and competitors?
Yes. Sociality.io tracks engagement rate for your Facebook, Instagram, LinkedIn, YouTube and TikTok accounts, and its Competitor Analysis compares engagement rate with competitors’ Facebook Pages, Instagram accounts and YouTube channels. With Sociality MCP, you can also ask ChatGPT, Claude or Gemini for your posts or a tracked competitor’s posts and have it work out the rate with the formula you choose.
How is engagement rate calculated?
Add up the interactions on a post, such as likes, comments, shares and saves, divide by an audience number (followers, reach, impressions or views) and multiply by 100. A post with 120 engagements and 4,000 impressions has a 3% engagement rate. The denominator you choose changes the result, so note it next to the number and use the same one when you compare posts or accounts.
What is ERR in social media?
ERR stands for engagement rate by reach: a post’s engagements divided by the number of accounts that saw it, multiplied by 100. It suits your own posts because it only counts accounts that were shown the post. It counts actions, not people, so one person who likes and comments adds two. Reach is private, so you can’t calculate ERR for a competitor’s posts.
How does X (Twitter) calculate engagement rate?
X divides engagements by impressions and multiplies by 100. An engagement is any action on the post: likes, replies, reposts, quotes, follows, and clicks on links, hashtags, media or your profile. Followers aren’t part of the formula. Some of those clicks are only visible to the account owner, so a rate you work out for someone else’s post from public numbers comes in at or below X’s own.
What is a good engagement rate on Instagram?
By followers, the median brand post on Instagram earned 0.30% in 2025, according to Rival IQ’s 2026 benchmark of 150 companies in each of 18 industries. Views-based rates on Reels run much higher: Red Bull’s Reels had a median of 2.52% by views in October 2026. Compare like with like, and treat your own trend and two or three similar competitors as the better yardstick.
What does total engagements mean?
Total engagements is the sum of every interaction on a post or account in a period: likes, comments, shares, saves and, on X and LinkedIn, clicks. It’s a count of actions, not people. It’s also the numerator of the engagement rate formula: divide it by followers, reach, impressions or views and multiply by 100 to get the rate.
Should I average engagement rates or divide totals?
Both are valid, but they answer different questions. Averaging each post’s rate shows how a typical post did, and every post counts equally. Dividing total engagements by total reach or views shows how the account did overall, and big posts count more. Two posts at 10% and 1% average 5.5%, while pooled they can come to under 2%. Say which one you report.
Why does my engagement rate differ from a calculator’s?
Calculators use public numbers, usually likes and comments divided by followers, averaged over recent posts. Your native analytics can add saves, shares, clicks and reach, which aren’t public. Different numerators, denominators, date windows and averaging methods all move the result, so two tools rarely agree on the same account. Compare numbers only when you know they were calculated the same way.